

Answered step by step
Verified Expert Solution
Question
1 Approved Answer
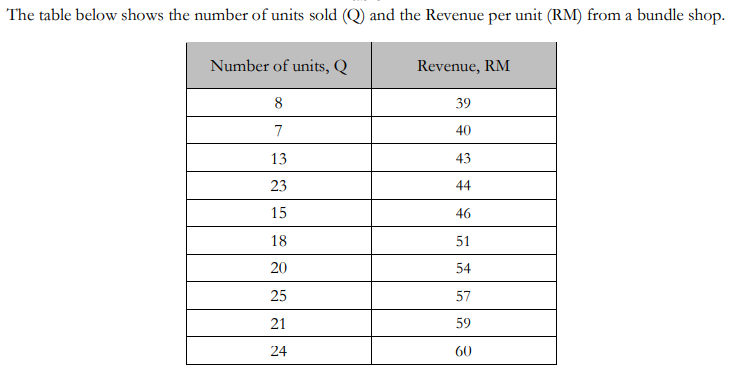
Question 2 Choose one table for each group and based on the table, students are required to answer these questions below, i. Draw a scatter


Step by Step Solution
There are 3 Steps involved in it
Step: 1

Get Instant Access to Expert-Tailored Solutions
See step-by-step solutions with expert insights and AI powered tools for academic success
Step: 2

Step: 3
Ace Your Homework with AI
Get the answers you need in no time with our AI-driven, step-by-step assistance
Get Started
Real Analysis
Authors: N L Carothers
1st Edition
1139632434, 9781139632430