

Answered step by step
Verified Expert Solution
Question
1 Approved Answer
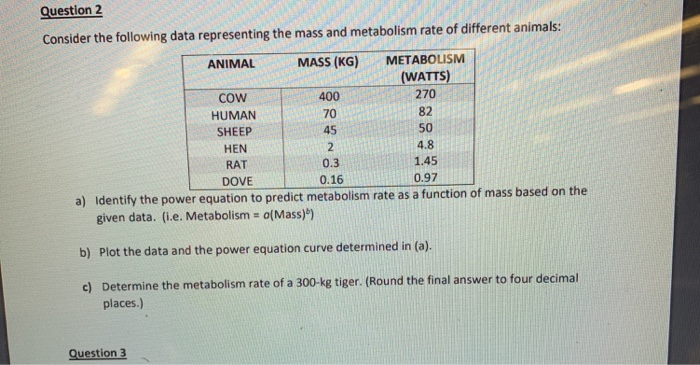
Question 2 Consider the following data representing the mass and metabolism rate of different animals: METABOLISM (WATTS) 270 82 50 4.8 1.45 0.97 ANIMAL MASS
Step by Step Solution
There are 3 Steps involved in it
Step: 1

Get Instant Access to Expert-Tailored Solutions
See step-by-step solutions with expert insights and AI powered tools for academic success
Step: 2

Step: 3
Ace Your Homework with AI
Get the answers you need in no time with our AI-driven, step-by-step assistance
Get Started
Concepts of Database Management
Authors: Philip J. Pratt, Joseph J. Adamski
7th edition
978-1111825911, 1111825912, 978-1133684374, 1133684378, 978-111182591