Answered step by step
Verified Expert Solution
Question
1 Approved Answer
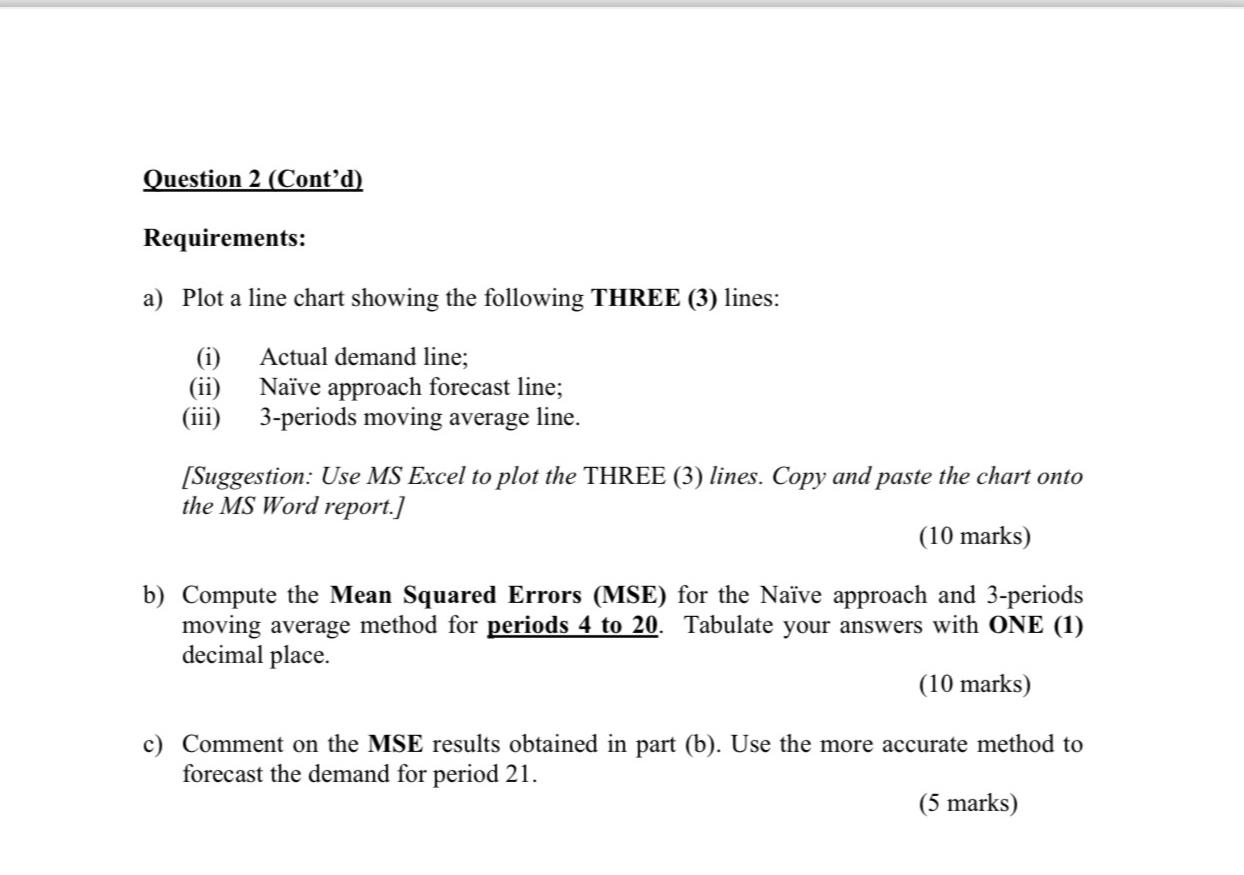
Question 2 ( Cont ' d ) Requirements: a ) Plot a line chart showing the following THREE ( 3 ) lines: ( i )
Question Contd
Requirements:
a Plot a line chart showing the following THREE lines:
i Actual demand line;
ii Nave approach forecast line;
iiiperiods moving average line.
Suggestion: Use MS Excel to plot the THREE lines. Copy and paste the chart onto the MS Word report.
marks
b Compute the Mean Squared Errors MSE for the Nave approach and periods moving average method for periods to Tabulate your answers with ONE decimal place.
marks
c Comment on the MSE results obtained in part b Use the more accurate method to forecast the demand for period
marks

Step by Step Solution
There are 3 Steps involved in it
Step: 1

Get Instant Access to Expert-Tailored Solutions
See step-by-step solutions with expert insights and AI powered tools for academic success
Step: 2

Step: 3

Ace Your Homework with AI
Get the answers you need in no time with our AI-driven, step-by-step assistance
Get Started


