

Answered step by step
Verified Expert Solution
Question
1 Approved Answer
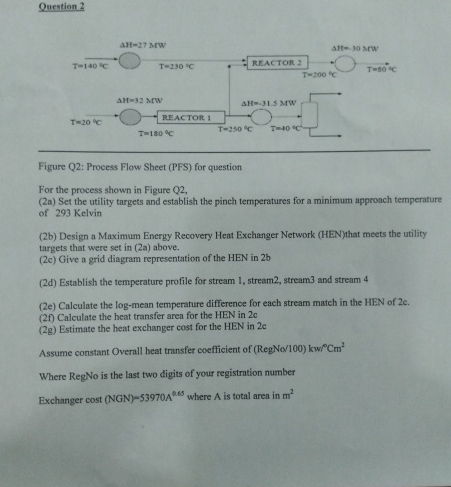
Question 2 Figure Q 2 : Process Flow Sheet ( PFS ) for question For the process shown in Figure Q 2 , ( 2
Question
Figure Q: Process Flow Sheet PFS for question
For the process shown in Figure Q
a Set the utility targets and establish the pinch temperatures for a minimum approach temperature of Kelvin
b Design a Maximum Energy Recovery Heat Exchanger Network HENthat meets the utility targets that were set in a above.
c Give a grid diagram representation of the HEN in
d Establish the temperature profile for stream stream stream and stream
e Calculate the logmean temperature difference for each stream match in the HEN of
f Calculate the heat transfer area for the HEN in
g Estimate the heat exchanger cost for the HEN in
Assume constant Overall heat transfer coefficient of
Where RegNo is the last two digits of your registration number
Exchanger cost where is total area in
Step by Step Solution
There are 3 Steps involved in it
Step: 1

Get Instant Access to Expert-Tailored Solutions
See step-by-step solutions with expert insights and AI powered tools for academic success
Step: 2

Step: 3
Ace Your Homework with AI
Get the answers you need in no time with our AI-driven, step-by-step assistance
Get Started
Surfactant Enhanced Subsurface Remediation Emerging Technologies
Authors: David A. Sabatini, Robert C. Knox, Jeffrey H. Harwell
1st Edition
0841232253, 978-0841232259