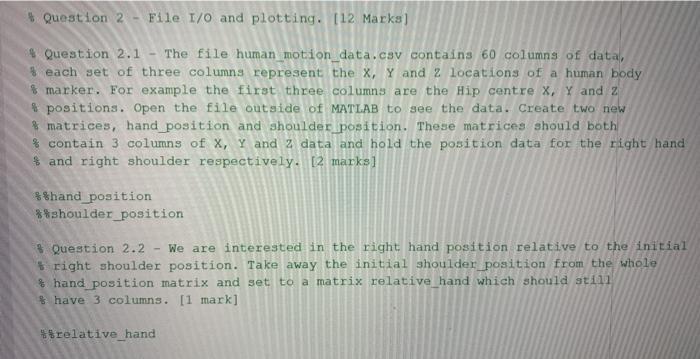
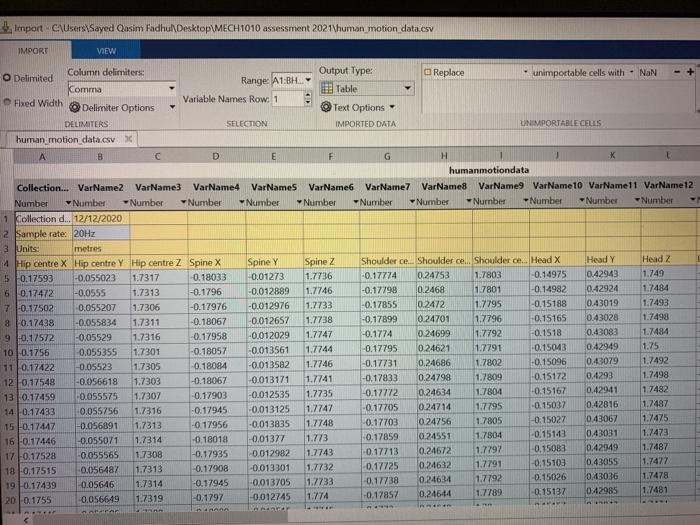
# Question 2 - File 1/0 and plotting. [12 Marks] Question 2.1 - The file human motion_data.csv contains 60 columns of data, $ each set of three columns represent the X, Y and 2 locations of a human body & marker. For example the first three columns are the Hip centre X, Y and z positions. Open the file outside of MATLAB to see the data. Create two new % matrices, hand position and shoulder position. These matrices should both % contain 3 columns of X, Y and 2 data and hold the position data for the right hand $ and right shoulder respectively. [2 marks] $$hand_position shoulder_position Question 2.2 We are interested in the right hand position relative to the initial right shoulder position. Take away the initial shoulder position from the whole & hand position matrix and set to a matrix relative_hand which should stil have 3 columns. [1 mark] relative_hand Import-C\Users\Sayed Qasim Fadhu Desktop MECH 1010 assessment 2021\human_motion data.es IMPORT VIEW O Delimited Column delimiters Output Type: Replace unimportable cells with NaN Range: A1:BHL Komma 1 Table Fixed Width Variable Names Row: 1 Delimiter Options Text Options DELIMITERS SELECTION IMPORTED DATA UNIMPORTABLE CELLS human motion data.csv) B D E G H K humanmotiondata Collection... Var Name2 VarName3 VarName4 Var Names VarName6 VarName7 VarName8 Var Name9 VarName10 Var Name11 VarName12 Number Number Number Number Number Number Number Number Number -Number Number Number 1 Collection d... 12/12/2020 2 Sample rate: 20Hz 3 Units metres 14 Hip centre X Hip centre Y Hip centre Z Spine X Spine Y Spine z Shoulder ce. Shoulder ce Shoulder ce.. Head X Heady Head z 5 0.17593 -0,055023 1.7317 -0.18033 0.01273 1.7736 -0.17774 0.24753 1.7803 0.14975 0.42943 1.749 6 0.17472 -0.055S 1.7313 -0.1796 -0.012889 1.7746 -0.17798 0.2468 1.7801 -0.14982 0.42924 1.7484 7 0.17502 0.055207 1.7306 -0.17976 -0.012976 1.7733 -0.17855 0.2472 1.7795 -0.15188 0.43019 1.7493 80.17438 -0.055834 1.7311 -0.18067 -0.012657 1.7738 -0.17899 0.24701 1,7796 -0.15165 043028 1.7498 9 -0.17572 -0.05529 1.7316 -0.17958 -0.012029 1.7747 -0.1774 0.24699 1.7792 -0.1518 0.43083 1.7484 100.1756 -0.055355 1.7301 -0.18057 -0.013561 1.7744 -0.17795 0.24621 1.7791 -0.15043 0.42949 1.75 110.17422 -0.05523 1.7305 -0.18084 -0.013582 1.7746 -0.17731 0.24686 1.7802 -0.15096 0.43079 1.7492 12 0,17548 -0.056618 1.7303 -0.18067 -0.013171 1.7741 -0.17833 0.24798 1.7809 -0.15172 0.4293 1.7498 13 0.17459 -0.055575 1.7307 -0.17903 -0.012535 1.7735 -0.17772 0.24634 1.7804 -0.15167 0.42941 1.7482 140.17433 -0,055756 1.7316 -0.17945 -0.013125 1.7747 -0.17705 0.24714 1.7795 -0.15037 0.42816 1.7487 15 0.17447 -0.056891 1.7313 -0.17956 -0.013835 1.7748 -0.17703 0.24756 1.7805 -0.15027 0.43067 1.7475 16 0.17446 -0.055071 1.7314 -0,18018 -0.01377 1.773 0.17859 0.24551 1.7804 0.15143 0.43031 1.7473 17 0.17528 -0.055565 1.7308 -0.17935 -0.012982 1.7743 -0.17713 0.24672 1.7797 0.15083 042949 1.7487 18 0,17515 -0.056487 1.7313 -0.17908 -0.013301 1.7732 0.17725 0.24632 1.7791 -0.15103 0.43055 1.7477 190.17439 -0.05646 1.7314 -0.17945 -0,013705 1.7733 -0.17738 0.24634 1.7792 0.15026 0.43036 1.7478 0.056649 2001755 1.7319 -0.012745 -0.1797 1.774 -0.17857 0.42985 0.24644 1.7789 0.15137 1.7481 . # Question 2 - File 1/0 and plotting. [12 Marks] Question 2.1 - The file human motion_data.csv contains 60 columns of data, $ each set of three columns represent the X, Y and 2 locations of a human body & marker. For example the first three columns are the Hip centre X, Y and z positions. Open the file outside of MATLAB to see the data. Create two new % matrices, hand position and shoulder position. These matrices should both % contain 3 columns of X, Y and 2 data and hold the position data for the right hand $ and right shoulder respectively. [2 marks] $$hand_position shoulder_position Question 2.2 We are interested in the right hand position relative to the initial right shoulder position. Take away the initial shoulder position from the whole & hand position matrix and set to a matrix relative_hand which should stil have 3 columns. [1 mark] relative_hand Import-C\Users\Sayed Qasim Fadhu Desktop MECH 1010 assessment 2021\human_motion data.es IMPORT VIEW O Delimited Column delimiters Output Type: Replace unimportable cells with NaN Range: A1:BHL Komma 1 Table Fixed Width Variable Names Row: 1 Delimiter Options Text Options DELIMITERS SELECTION IMPORTED DATA UNIMPORTABLE CELLS human motion data.csv) B D E G H K humanmotiondata Collection... Var Name2 VarName3 VarName4 Var Names VarName6 VarName7 VarName8 Var Name9 VarName10 Var Name11 VarName12 Number Number Number Number Number Number Number Number Number -Number Number Number 1 Collection d... 12/12/2020 2 Sample rate: 20Hz 3 Units metres 14 Hip centre X Hip centre Y Hip centre Z Spine X Spine Y Spine z Shoulder ce. Shoulder ce Shoulder ce.. Head X Heady Head z 5 0.17593 -0,055023 1.7317 -0.18033 0.01273 1.7736 -0.17774 0.24753 1.7803 0.14975 0.42943 1.749 6 0.17472 -0.055S 1.7313 -0.1796 -0.012889 1.7746 -0.17798 0.2468 1.7801 -0.14982 0.42924 1.7484 7 0.17502 0.055207 1.7306 -0.17976 -0.012976 1.7733 -0.17855 0.2472 1.7795 -0.15188 0.43019 1.7493 80.17438 -0.055834 1.7311 -0.18067 -0.012657 1.7738 -0.17899 0.24701 1,7796 -0.15165 043028 1.7498 9 -0.17572 -0.05529 1.7316 -0.17958 -0.012029 1.7747 -0.1774 0.24699 1.7792 -0.1518 0.43083 1.7484 100.1756 -0.055355 1.7301 -0.18057 -0.013561 1.7744 -0.17795 0.24621 1.7791 -0.15043 0.42949 1.75 110.17422 -0.05523 1.7305 -0.18084 -0.013582 1.7746 -0.17731 0.24686 1.7802 -0.15096 0.43079 1.7492 12 0,17548 -0.056618 1.7303 -0.18067 -0.013171 1.7741 -0.17833 0.24798 1.7809 -0.15172 0.4293 1.7498 13 0.17459 -0.055575 1.7307 -0.17903 -0.012535 1.7735 -0.17772 0.24634 1.7804 -0.15167 0.42941 1.7482 140.17433 -0,055756 1.7316 -0.17945 -0.013125 1.7747 -0.17705 0.24714 1.7795 -0.15037 0.42816 1.7487 15 0.17447 -0.056891 1.7313 -0.17956 -0.013835 1.7748 -0.17703 0.24756 1.7805 -0.15027 0.43067 1.7475 16 0.17446 -0.055071 1.7314 -0,18018 -0.01377 1.773 0.17859 0.24551 1.7804 0.15143 0.43031 1.7473 17 0.17528 -0.055565 1.7308 -0.17935 -0.012982 1.7743 -0.17713 0.24672 1.7797 0.15083 042949 1.7487 18 0,17515 -0.056487 1.7313 -0.17908 -0.013301 1.7732 0.17725 0.24632 1.7791 -0.15103 0.43055 1.7477 190.17439 -0.05646 1.7314 -0.17945 -0,013705 1.7733 -0.17738 0.24634 1.7792 0.15026 0.43036 1.7478 0.056649 2001755 1.7319 -0.012745 -0.1797 1.774 -0.17857 0.42985 0.24644 1.7789 0.15137 1.7481