Answered step by step
Verified Expert Solution
Question
1 Approved Answer
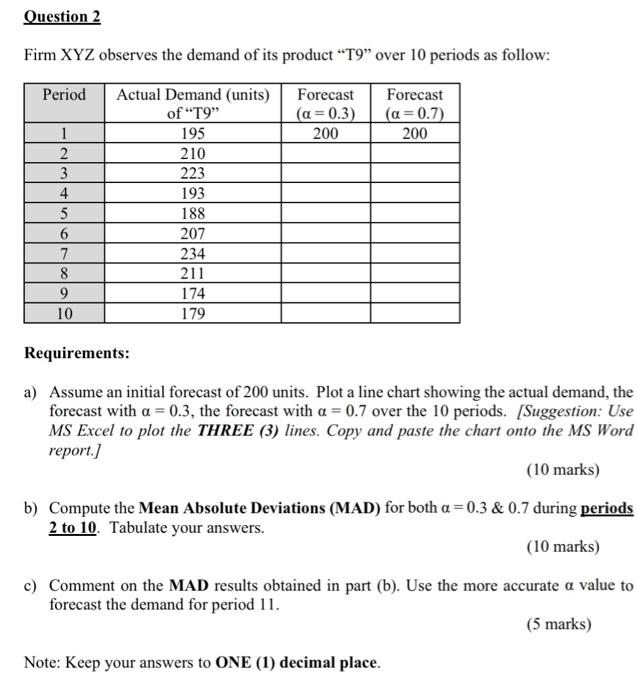
Question 2 Firm XYZ observes the demand of its product T9 over 10 periods as follow: Actual Demand (units) Forecast of T9 (a=0.7) 200

Question 2 Firm XYZ observes the demand of its product "T9" over 10 periods as follow: Actual Demand (units) Forecast of "T9" (a=0.7) 200 Period 1 2 3 4 5 6 7 8 9 10 195 210 223 193 188 207 234 211 174 179 Forecast (a=0.3) 200 Requirements: a) Assume an initial forecast of 200 units. Plot a line chart showing the actual demand, the forecast with a = 0.3, the forecast with a = 0.7 over the 10 periods. [Suggestion: Use MS Excel to plot the THREE (3) lines. Copy and paste the chart onto the MS Word report.] (10 marks) b) Compute the Mean Absolute Deviations (MAD) for both a=0.3 & 0.7 during periods 2 to 10. Tabulate your answers. (10 marks) c) Comment on the MAD results obtained in part (b). Use the more accurate a value to forecast the demand for period 11. (5 marks) Note: Keep your answers to ONE (1) decimal place.
Step by Step Solution
★★★★★
3.32 Rating (149 Votes )
There are 3 Steps involved in it
Step: 1
Certainly Lets tackle each of the requirements stepbystep a To create the line chart showing the actual demand and the forecasts with 03 and 07 we wou...
Get Instant Access to Expert-Tailored Solutions
See step-by-step solutions with expert insights and AI powered tools for academic success
Step: 2

Step: 3

Ace Your Homework with AI
Get the answers you need in no time with our AI-driven, step-by-step assistance
Get Started


