Answered step by step
Verified Expert Solution
Question
1 Approved Answer
Question 2: Identify the most relevant sources of financial risk, and examine how these are being managed today. Include a description of the risk, a

Question 2:
Identify the most relevant sources of financial risk, and examine how these are being managed today. Include a description of the risk, a sensitivity analysis based on your forecast for the risks identified, and any other relevant information. (30 Marks, 600 Words)
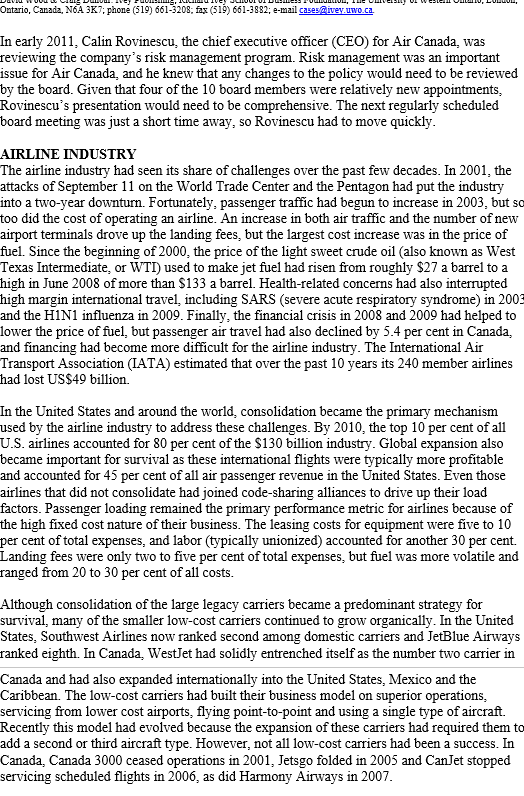
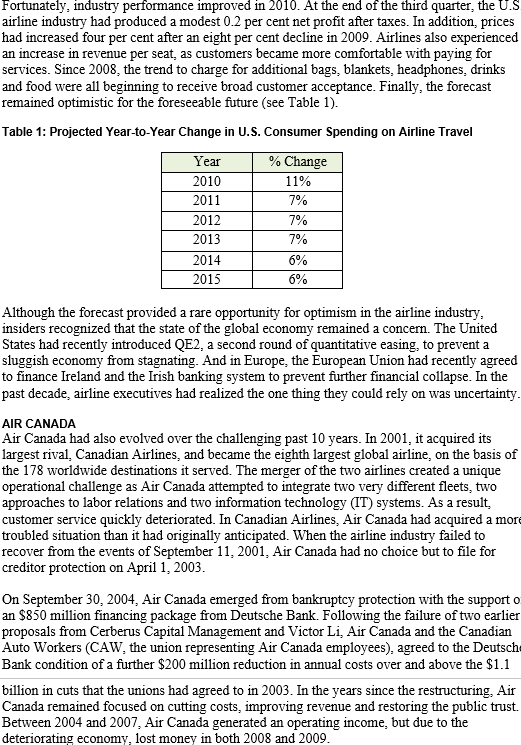
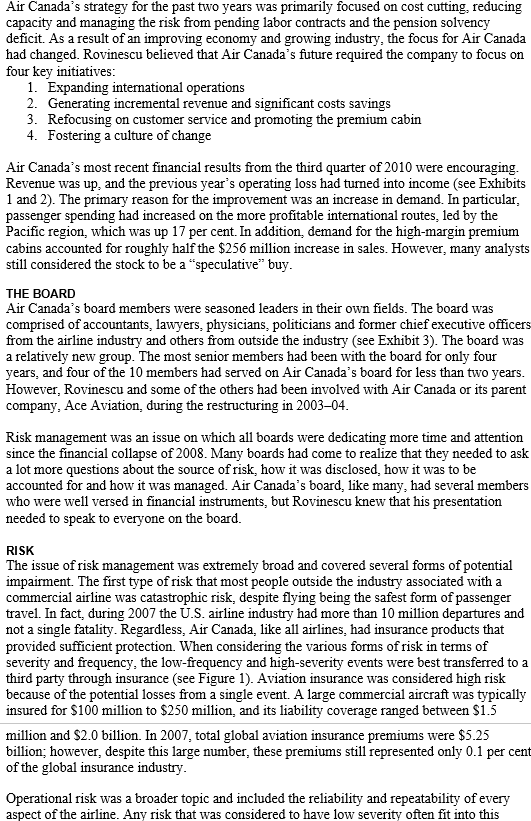
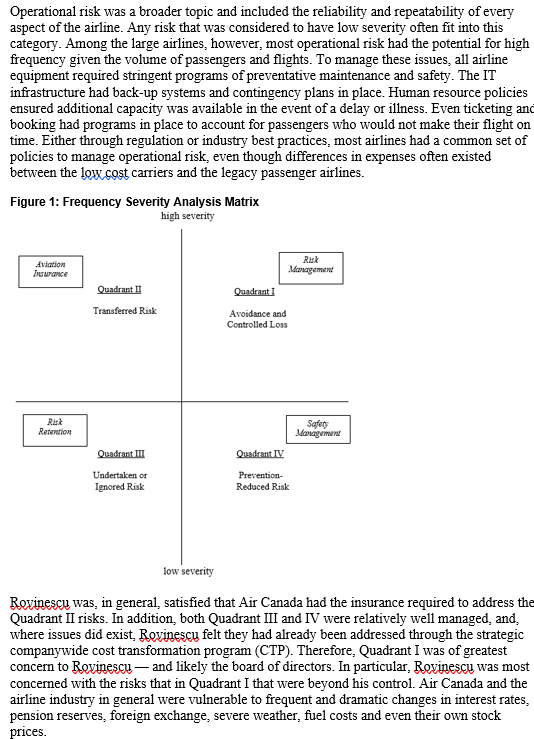
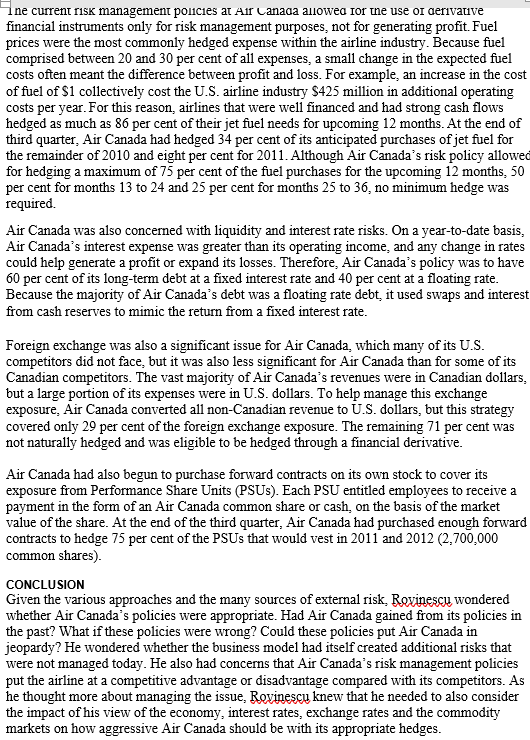
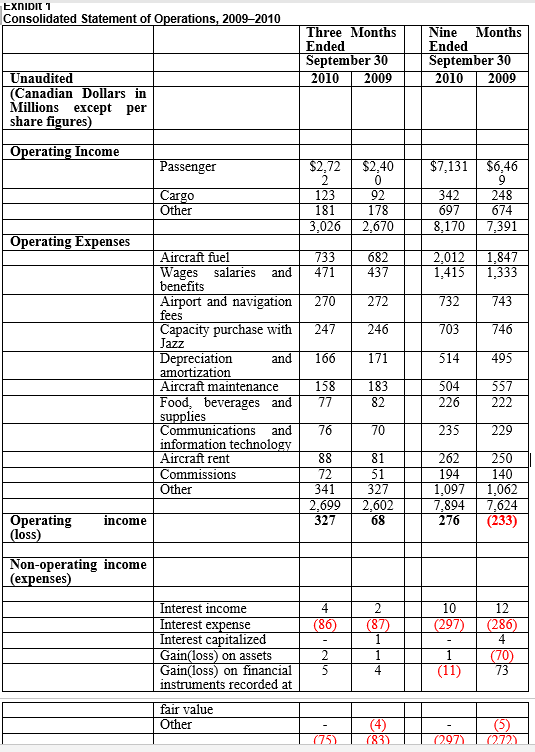
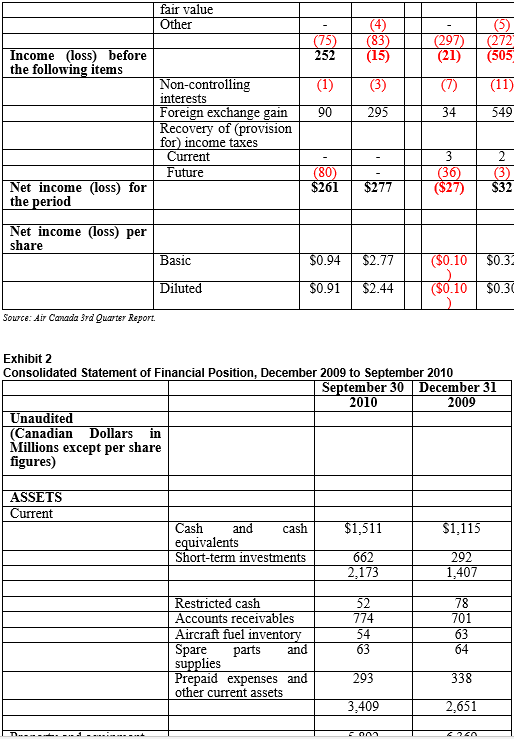
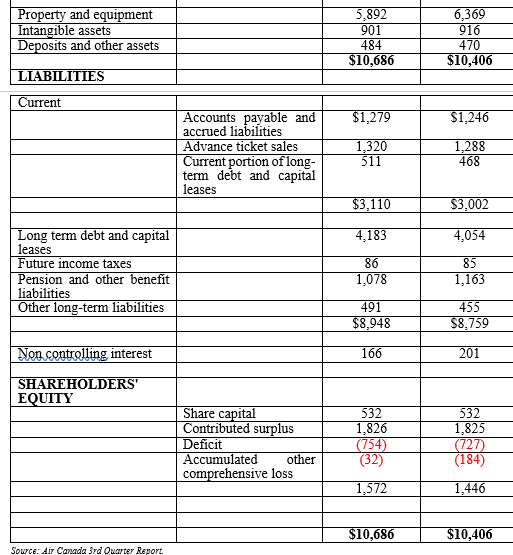
Ontario, Canada, N6A 3K7; phone (519) 661-3208; fax (519) 661-3882; e-mail cases @ivey.uwo.ca In early 2011, Calin Rovinescu, the chief executive officer (CEO) for Air Canada, was reviewing the company's risk management program. Risk management was an important issue for Air Canada, and he knew that any changes to the policy would need to be reviewed by the board. Given that four of the 10 board members were relatively new appointments, Rovinescu's presentation would need to be comprehensive. The next regularly scheduled board meeting was just a short time away, so Rovinescu had to move quickly. AIRLINE INDUSTRY The airline industry had seen its share of challenges over the past few decades. In 2001, the attacks of September 11 on the World Trade Center and the Pentagon had put the industry into a two-year downturn. Fortunately, passenger traffic had begun to increase in 2003, but so too did the cost of operating an airline. An increase in both air traffic and the number of new airport terminals drove up the landing fees, but the largest cost increase was in the price of fuel. Since the beginning of 2000, the price of the light sweet crude oil (also known as West Texas Intermediate, or WTI) used to make jet fuel had risen from roughly $27 a barrel to a high in June 2008 of more than $133 a barrel. Health-related concerns had also interrupted high margin international travel, including SARS (severe acute respiratory syndrome) in 2003 and the H1N1 influenza in 2009. Finally, the financial crisis in 2008 and 2009 had helped to lower the price of fuel, but passenger air travel had also declined by 5.4 per cent in Canada, and financing had become more difficult for the airline industry. The International Air Transport Association (IATA) estimated that over the past 10 years its 240 member airlines had lost US$49 billion." In the United States and around the world, consolidation became the primary mechanism used by the airline industry to address these challenges. By 2010, the top 10 per cent of all U.S. airlines accounted for 80 per cent of the $130 billion industry. Global expansion also became important for survival as these international flights were typically more profitable and accounted for 45 per cent of all air passenger revenue in the United States. Even those airlines that did not consolidate had joined code-sharing alliances to drive up their load factors. Passenger loading remained the primary performance metric for airlines because of the high fixed cost nature of their business. The leasing costs for equipment were five to 10 per cent of total expenses, and labor (typically unionized) accounted for another 30 per cent. Landing fees were only two to five per cent of total expenses, but fuel was more volatile and ranged from 20 to 30 per cent of all costs. Although consolidation of the large legacy carriers became a predominant strategy for survival, many of the smaller low-cost carriers continued to grow organically. In the United States, Southwest Airlines now ranked second among domestic carriers and JetBlue Airways ranked eighth. In Canada, WestJet had solidly entrenched itself as the number two carrier in Canada and had also expanded internationally into the United States, Mexico and the Caribbean. The low-cost carriers had built their business model on superior operations, servicing from lower cost airports, flying point-to-point and using a single type of aircraft. Recently this model had evolved because the expansion of these carriers had required them to add a second or third aircraft type. However, not all low-cost carriers had been a success. In Canada Canada 3000 ceased operations in 2001, Jetsgo folded in 2005 and CanJet stopped servicing scheduled flights in 2006, as did Harmony Airways in 2007. Fortunately, industry performance improved in 2010. At the end of the third quarter, the U.S airline industry had produced a modest 0.2 per cent net profit after taxes. In addition, prices had increased four per cent after an eight per cent decline in 2009. Airlines also experienced an increase in revenue per seat, as customers became more comfortable with paying for services. Since 2008, the trend to charge for additional bags, blankets, headphones, drinks and food were all beginning to receive broad customer acceptance. Finally, the forecast remained optimistic for the foreseeable future (see Table 1). Table 1: Projected Year-to-Year Change in U.S. Consumer Spending on Airline Travel Year 2010 2011 2012 2013 2014 2015 % Change 11% 7% 7% 7% 6% 6% Although the forecast provided a rare opportunity for optimism in the airline industry, insiders recognized that the state of the global economy remained a concern. The United States had recently introduced QE2, a second round of quantitative easing, to prevent a sluggish economy from stagnating. And in Europe, the European Union had recently agreed to finance Ireland and the Irish banking system to prevent further financial collapse. In the past decade airline executives had realized the one thing they could rely on was uncertainty. AIR CANADA Air Canada had also evolved over the challenging past 10 years. In 2001, it acquired its largest rival, Canadian Airlines, and became the eighth largest global airline, on the basis of the 178 worldwide destinations it served. The merger of the two airlines created a unique operational challenge as Air Canada attempted to integrate two very different fleets, two approaches to labor relations and two information technology (IT) systems. As a result, customer service quickly deteriorated. In Canadian Airlines, Air Canada had acquired a more troubled situation than it had originally anticipated. When the airline industry failed to recover from the events of September 11, 2001, Air Canada had no choice but to file for creditor protection on April 1, 2003. On September 30, 2004, Air Canada emerged from bankruptcy protection with the supporto an $850 million financing package from Deutsche Bank. Following the failure of two earlier proposals from Cerberus Capital Management and Victor Li, Air Canada and the Canadian Auto Workers (CAW, the union representing Air Canada employees), agreed to the Deutsch Bank condition of a further $200 million reduction in annual costs over and above the $1.1 billion in cuts that the unions had agreed to in 2003. In the years since the restructuring, Air Canada remained focused on cutting costs, improving revenue and restoring the public trust. Between 2004 and 2007, Air Canada generated an operating income, but due to the deteriorating economy, lost money in both 2008 and 2009. Air Canada's strategy for the past two years was primarily focused on cost cutting, reducing capacity and managing the risk from pending labor contracts and the pension solvency deficit. As a result of an improving economy and growing industry, the focus for Air Canada had changed. Rovinescu believed that Air Canada's future required the company to focus on four key initiatives: 1. Expanding international operations 2. Generating incremental revenue and significant costs savings 3. Refocusing on customer service and promoting the premium cabin 4. Fostering a culture of change Air Canada's most recent financial results from the third quarter of 2010 were encouraging. Revenue was up, and the previous year's operating loss had turned into income (see Exhibits 1 and 2). The primary reason for the improvement was an increase in demand. In particular, passenger spending had increased on the more profitable international routes, led by the Pacific region, which was up 17 per cent. In addition demand for the high-margin premium cabins accounted for roughly half the $256 million increase in sales. However, many analysts still considered the stock to be a speculative buy. THE BOARD Air Canada's board members were seasoned leaders in their own fields. The board was comprised of accountants, lawyers, physicians, politicians and former chief executive officers from the airline industry and others from outside the industry (see Exhibit 3). The board was a relatively new group. The most senior members had been with the board for only four years, and four of the 10 members had served on Air Canada's board for less than two years. However, Rovinescu and some of the others had been involved with Air Canada or its parent company, Ace Aviation during the restructuring in 200304. Risk management was an issue on which all boards were dedicating more time and attention since the financial collapse of 2008. Many boards had come to realize that they needed to ask a lot more questions about the source of risk, how it was disclosed, how it was to be accounted for and how it was managed. Air Canada's board, like many, had several members who were well versed in financial instruments, but Rovinescu knew that his presentation needed to speak to everyone on the board. RISK The issue of risk management was extremely broad and covered several forms of potential impairment. The first type of risk that most people outside the industry associated with a commercial airline was catastrophic risk, despite flying being the safest form of passenger travel. In fact, during 2007 the U.S. airline industry had more than 10 million departures and not a single fatality. Regardless, Air Canada, like all airlines, had insurance products that provided sufficient protection. When considering the various forms of risk in terms of severity and frequency, the low-frequency and high-severity events were best transferred to a third party through insurance (see Figure 1). Aviation insurance was considered high risk because of the potential losses from a single event. A large commercial aircraft was typically insured for $100 million to $250 million, and its liability coverage ranged between $1.5 million and $2.0 billion. In 2007, total global aviation insurance premiums were $5.25 billion; however, despite this large number, these premiums still represented only 0.1 per cent of the global insurance industry. Operational risk was a broader topic and included the reliability and repeatability of every aspect of the airline. Any risk that was considered to have low severity often fit into this Operational risk was a broader topic and included the reliability and repeatability of every aspect of the airline. Any risk that was considered to have low severity often fit into this category. Among the large airlines, however, most operational risk had the potential for high frequency given the volume of passengers and flights. To manage these issues, all airline equipment required stringent programs of preventative maintenance and safety. The IT infrastructure had back-up systems and contingency plans in place. Human resource policies ensured additional capacity was available in the event of a delay or illness. Even ticketing and booking had programs in place to account for passengers who would not make their flight on time. Either through regulation or industry best practices, most airlines had a common set of policies to manage operational risk, even though differences in expenses often existed between the low cost carriers and the legacy passenger airlines. Figure 1: Frequency Severity Analysis Matrix high severity Aviation TRESNO Risk Management Quadrant 1 Quadrant II Transferred Risk Avoidance and Controlled Loss Risk Retention Quadrant III Undertaken or Ignored Risk Safen Management Quadrant IV Prevention Reduced Risk low severity Rovinescu was, in general, satisfied that Air Canada had the insurance required to address the Quadrant II risks. In addition, both Quadrant III and IV were relatively well managed, and where issues did exist. Rovinescu felt they had already been addressed through the strategic companywide cost transformation program (CTP). Therefore, Quadrant I was of greatest concern to Rovinescu - and likely the board of directors. In particular, Rovinescu was most concerned with the risks that in Quadrant I that were beyond his control. Air Canada and the airline industry in general were vulnerable to frequent and dramatic changes in interest rates, pension reserves, foreign exchange, severe weather, fuel costs and even their own stock prices. I ne current risk management policies at Air Canada allowed for ine use or derivauve financial instruments only for risk management purposes, not for generating profit. Fuel prices were the most commonly hedged expense within the airline industry. Because fuel comprised between 20 and 30 per cent of all expenses, a small change in the expected fuel costs often meant the difference between profit and loss. For example, an increase in the cost of fuel of $1 collectively cost the U.S. airline industry $425 million in additional operating costs per year. For this reason, airlines that were well financed and had strong cash flows hedged as much as 86 per cent of their jet fuel needs for upcoming 12 months. At the end of third quarter, Air Canada had hedged 34 per cent of its anticipated purchases of jet fuel for the remainder of 2010 and eight per cent for 2011. Although Air Canada's risk policy allowed for hedging a maximum of 75 per cent of the fuel purchases for the upcoming 12 months. 50 per cent for months 13 to 24 and 25 per cent for months 25 to 36, no minimum hedge was required. Air Canada was also concerned with liquidity and interest rate risks. On a year-to-date basis, Air Canada's interest expense was greater than its operating income, and any change in rates could help generate a profit or expand its losses. Therefore, Air Canada's policy was to have 60 per cent of its long-term debt at a fixed interest rate and 40 per cent at a floating rate. Because the majority of Air Canada's debt was a floating rate debt, it used swaps and interest from cash reserves to mimic the return from a fixed interest rate. Foreign exchange was also a significant issue for Air Canada, which many of its U.S. competitors did not face, but it was also less significant for Air Canada than for some of its Canadian competitors. The vast majority of Air Canada's revenues were in Canadian dollars. but a large portion of its expenses were in U.S. dollars. To help manage this exchange exposure. Air Canada converted all non-Canadian revenue to U.S. dollars, but this strategy covered only 29 per cent of the foreign exchange exposure. The remaining 71 per cent was not naturally hedged and was eligible to be hedged through a financial derivative. Air Canada had also begun to purchase forward contracts on its own stock to cover its exposure from Performance Share Units (PSUS). Each PSU entitled employees to receive a payment in the form of an Air Canada common share or cash on the basis of the market value of the share. At the end of the third quarter, Air Canada had purchased enough forward contracts to hedge 75 per cent of the PSUs that would vest in 2011 and 2012 (2,700,000 common shares). CONCLUSION Given the various approaches and the many sources of external risk. Rovinescu wondered whether Air Canada's policies were appropriate. Had Air Canada gained from its policies in the past? What if these policies were wrong? Could these policies put Air Canada in jeopardy? He wondered whether the business model had itself created additional risks that were not managed today. He also had concerns that Air Canada's risk management policies put the airline at a competitive advantage or disadvantage compared with its competitors. As he thought more about managing the issue, Revinescu knew that he needed to also consider the impact of his view of the economy, interest rates, exchange rates and the commodity markets on how aggressive Air Canada should be with its appropriate hedges. Revinescu knew he was running out of time before the next board meeting. He decided to start by identifying the most relevant sources of external risk that could materially affect Air Canada's short-term and long-term financial performance. He then wanted to understand how these risks were managed today and how they compared with Air Canada's largest competitor, WestJet. Finally, he wanted to determine what changes should be made to either eliminate the source of risk or better manage any significant risks that remained. Given Revinescu's upcoming schedule, he gave himself two weeks to prepare his report for the board. EXNIDIT 1 Consolidated Statement of Operations, 2009-2010 Three Months Ended September 30 2010 2009 Nine Months Ended September 30 2010 2009 Unaudited (Canadian Dollars in Millions except per share figures) Operating Income Passenger $2,72 $2,40 $7,131 $6,46 Cargo Other 123 181 3,026 92 178 2,670 342 697 8,170 248 674 7,391 Operating Expenses 733 471 682 437 2,012 1,415 1,847 1,333 270 272 732 743 247 246 703 746 166 171 514 495 Aircraft fuel Wages salaries and benefits Airport and navigation fees Capacity purchase with Jazz Depreciation and amortization Aircraft maintenance Food, beverages and supplies Communications and information technology Aircraft rent Commissions Other 158 77 183 82 504 226 557 222 76 70 235 229 88 72 341 2,699 327 81 51 327 2,602 68 262 194 1,097 7.894 276 250 140 1,062 7,624 (233) Operating income (loss) Non-operating income (expenses) 4 (86) 10 (297) 12 (286) (87) Interest income Interest expense Interest capitalized Gain(loss) on assets Gain(loss) on financial instruments recorded at 2 5 (70) 73 4 (11) fair value Other (75) 1993 (4) (83) (5) (272) (297) fair value Other (75) 252 (83) (15) (297) (21) (5) (272 (505 (1) (3) (7) (11) 90 295 34 549 Income (loss) before the following items Non-controlling interests Foreign exchange gain Recovery of (provision for) income taxes Current Future Net income (loss) for the period (80) $261 3 (36) ($27) 2 (3) $32 $277 Net income (loss) per share Basic $0.94 $2.77 ($0.10 $0.32 Diluted $0.91 $2.44 ($0.10 $0.3 Source: Air Canada 3rd Quarter Report. Exhibit 2 Consolidated Statement of Financial Position, December 2009 to September 2010 September 30 December 31 2010 2009 Unaudited (Canadian Dollars in Millions except per share figures) ASSETS Current $1,511 $1,115 Cash and cash equivalents Short-term investments 662 2,173 292 1,407 Restricted cash Accounts receivables Aircraft fuel inventory Spare parts and supplies Prepaid expenses and other current assets 52 774 54 63 78 701 63 64 293 338 3,409 2,651 Property and equipment Intangible assets Deposits and other assets 5,892 901 484 $10,686 6,369 916 470 $10,406 LIABILITIES Current $1,279 $1,246 Accounts payable and accrued liabilities Advance ticket sales Current portion of long- term debt and capital leases 1,320 511 1,288 468 $3,110 $3,002 4,183 4,054 Long term debt and capital leases Future income taxes Pension and other benefit liabilities Other long-term liabilities 86 1,078 85 1,163 491 $8,948 455 $8.759 Non controlling interest 166 201 SHAREHOLDERS' EQUITY Share capital Contributed surplus Deficit Accumulated other comprehensive loss 532 1,826 (754) (32) 532 1,825 (727) (184) 1,572 1,446 $10,686 $10,406 Sowce: Air Canada 3rd Quarter ReportStep by Step Solution
There are 3 Steps involved in it
Step: 1

Get Instant Access to Expert-Tailored Solutions
See step-by-step solutions with expert insights and AI powered tools for academic success
Step: 2

Step: 3

Ace Your Homework with AI
Get the answers you need in no time with our AI-driven, step-by-step assistance
Get Started


