Answered step by step
Verified Expert Solution
Link Copied!

Question

1 Approved Answer

Question 2 If each cell uses the same power, then the total power used will be proportional to the number of cells. If all cells

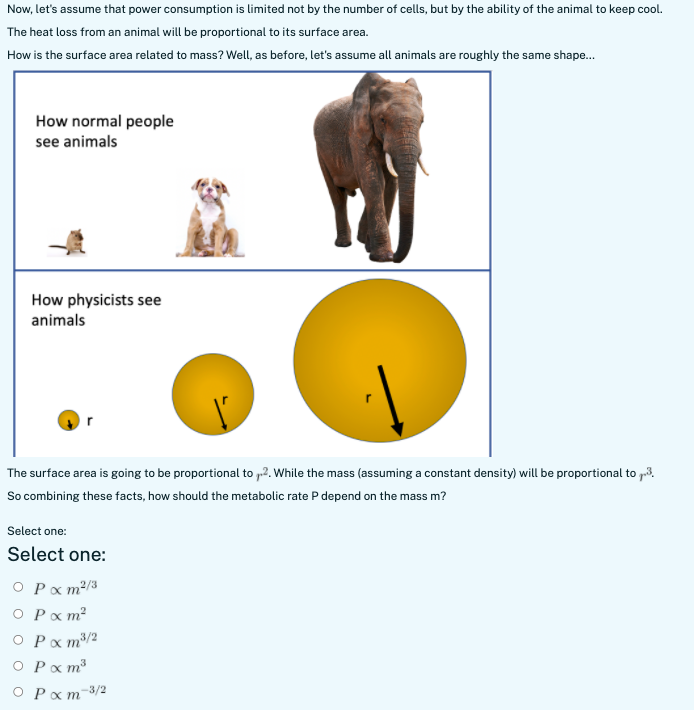
image text in transcribedimage text in transcribedimage text in transcribed
Question 2 If each cell uses the same power, then the total power used will be proportional to the number of cells. If all cells have (on average) roughly the same size and density, how would you expect the total power to correlate to the total mass of animals? Select one: Select one: O P x m O Pxm-2 O Pxml O P x mNow, let's assume that power consumption is limited not by the number of cells, but by the ability of the animal to keep cool. The heat loss from an animal will be proportional to its surface area. How is the surface area related to mass? Well, as before, let's assume all animals are roughly the same shape... How normal people see animals How physicists see animals The surface area is going to be proportional to 2. While the mass (assuming a constant density) will be proportional to p-3. So combining these facts, how should the metabolic rate P depend on the mass m? Select one: Select one: O P o m2/3 O P x m O P o m3/2 O Pom O Pom-3/2So which of our hypotheses fit the data? If we assume that all cells use the same power, regardless of animal size, then the metabolic rate P oc m. But if we assume that not overheating is what limits animals, then we get a P proportional to m raised to a different power. If P o m. then if Pincreases from 0.01 to 10,000 (the limits on our graph), i.e. a factor of 106, then we expect p to also increase by a factor of 106. But if not overheating is the limiting factor, then we would expect / to increase by a different factor. Using the graph, deduce which hypothesis best fits the data. Select one: Select one: O a. The data are consistent with each cell having a constant power, regardless of the animal size. O b. The data are consistent with metabolic rates being limited by cooling. O c. The data disagree strongly with both models. O d. Poc m3/2

Step by Step Solution

There are 3 Steps involved in it

Step: 1

blur-text-image

Get Instant Access to Expert-Tailored Solutions

See step-by-step solutions with expert insights and AI powered tools for academic success

Step: 2

blur-text-image

Step: 3

blur-text-image

Ace Your Homework with AI

Get the answers you need in no time with our AI-driven, step-by-step assistance

Get Started

Recommended Textbook for

Physics

Authors: John D. Cutnell, Kenneth W. Johnson

9th edition

470879564, 1118424840, 470879521, 9780470879566, 9781118424841, 978-0470879528

More Books

Students also viewed these Physics questions

Question

=+ a. A change in consumer preferences increases the saving rate.

Answered: 1 week ago