

Answered step by step
Verified Expert Solution
Question
1 Approved Answer
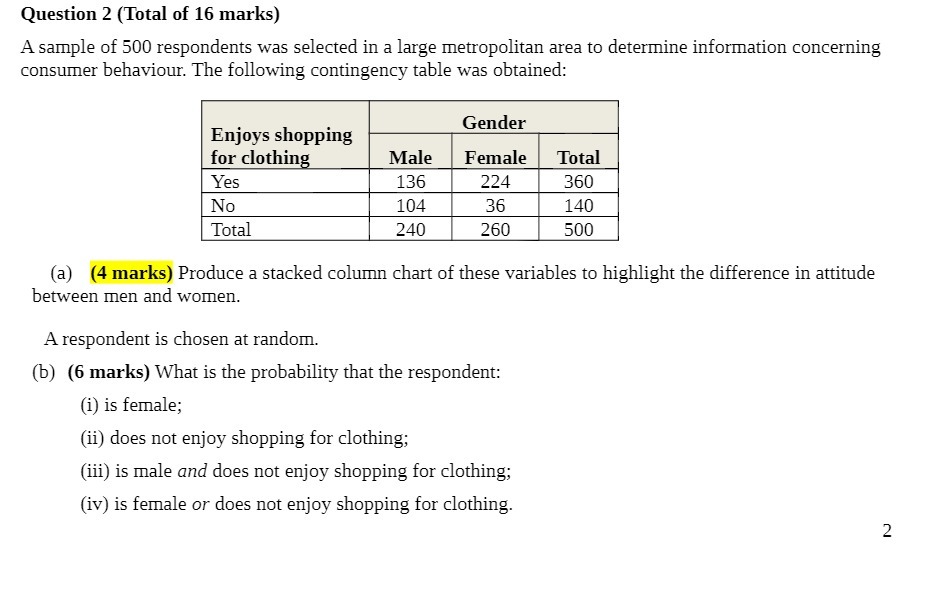
Question 2 [Iota] of 16 marks] A sample of 500 respondents was selected in a large metropolitan area to determine information concerning consumer behaviour. The
Step by Step Solution
There are 3 Steps involved in it
Step: 1

Get Instant Access to Expert-Tailored Solutions
See step-by-step solutions with expert insights and AI powered tools for academic success
Step: 2

Step: 3
Ace Your Homework with AI
Get the answers you need in no time with our AI-driven, step-by-step assistance
Get Started
Transportation A Global Supply Chain Perspective
Authors: John J. Coyle, Robert A. Novak, Brian Gibson, Edward J. Bard
8th edition