

Question
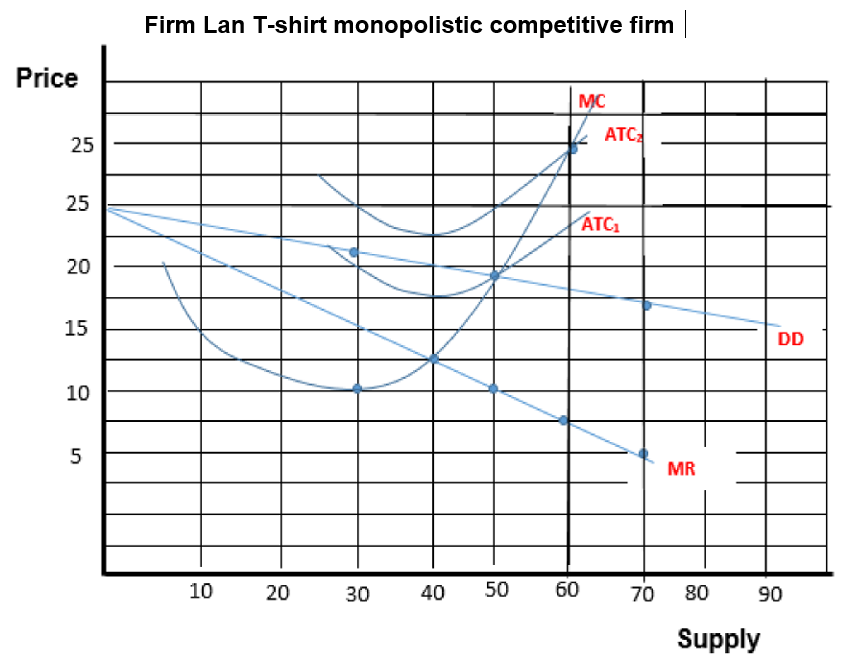
Question 2: Monopolistic and Oligopoly firms Question 1 (i)Use the graph below to explain the output, profit and loss conditions for monopolistically competitive firms. Show
Question 2: Monopolistic and Oligopoly firms
Question 1
(i)Use the graph below to explain the output, profit and loss conditions for monopolistically competitive firms. Show your work where appropriate in reference to the Graph.
Step by Step Solution
There are 3 Steps involved in it
Step: 1

Get Instant Access to Expert-Tailored Solutions
See step-by-step solutions with expert insights and AI powered tools for academic success
Step: 2

Step: 3
Ace Your Homework with AI
Get the answers you need in no time with our AI-driven, step-by-step assistance
Get Started
Macroeconomics Principles And Policy
Authors: William J. Baumol, Alan S. Blinder
11th Edition
0324586213, 978-0324586213