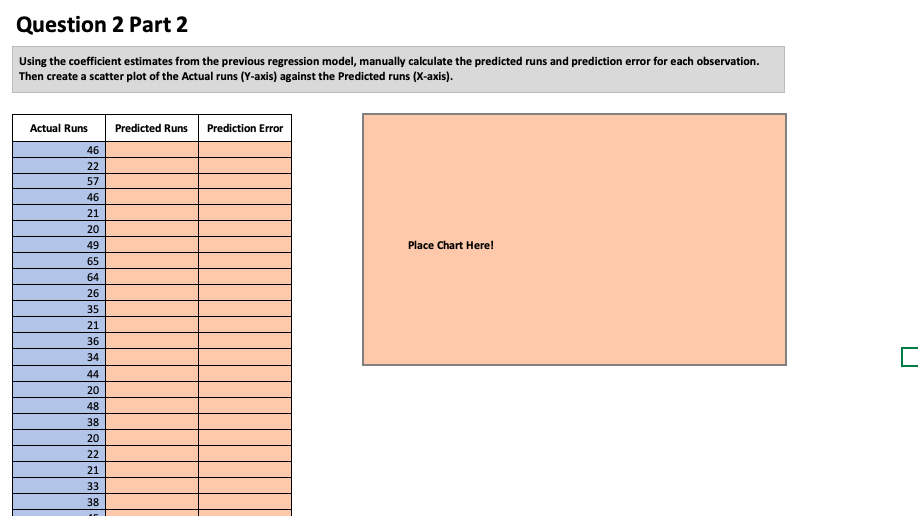
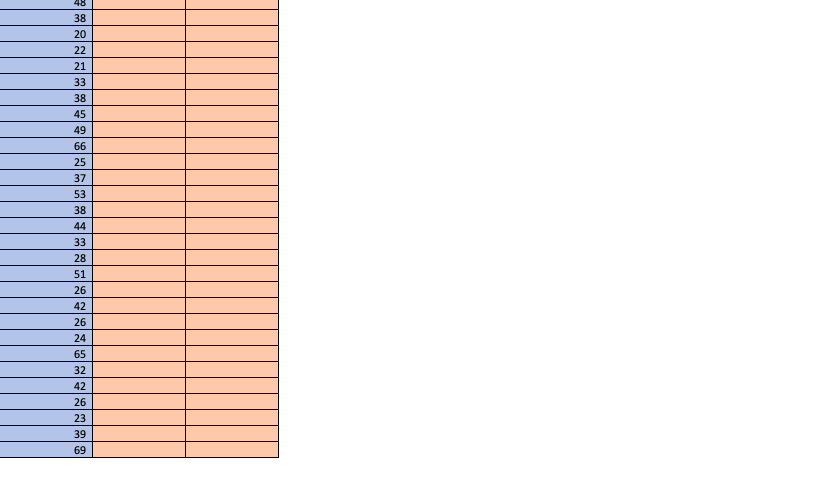
QUESTION 2 PART 2: (THE ONE I NEED HELP WITH) : Using the coefficient estimates from the previous regression model, manually calculate the predicted runs and prediction error for each observation. Then create a scatter plot of the Actual runs (Y-axis) against the Predicted runs (X-axis).
The first two (blue) pictures of info is from the previous question if you need the data but I need to answer Question 2 Part 2 and need to know the formulas/steps to type into excel. Thanks
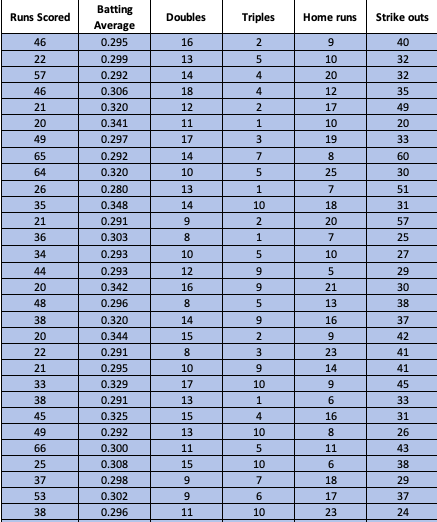
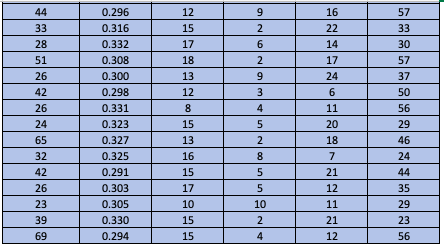
Runs Scored Doubles Triples Home runs Strike outs 9 2 5 10 46 22 57 46 16 13 14 18 4 20 12 4 2 21 20 49 65 64 1 12 11 17 14 10 40 32 32 35 49 20 33 60 30 17 10 19 3 7 5 8 26 13 1 25 7 18 20 14 10 2 51 31 57 9 8 7 Batting Average 0.295 0.299 0.292 0.306 0.320 0.341 0.297 0.292 0.320 0.280 0.348 0.291 0.303 0.293 0.293 0.342 0.296 0.320 0.344 0.291 0.295 0.329 0.291 0.325 0.292 0.300 0.308 0.298 0.302 0.296 10 12 16 8 25 27 29 30 38 35 21 36 34 44 20 48 38 20 22 21 33 38 45 49 66 25 37 53 38 1 5 9 9 5 9 2 3 9 10 37 42 10 5 21 13 16 9 23 14 9 6 16 8 11 6 18 17 23 14 15 8 10 17 13 15 13 11 15 9 9 11 1 4 10 5 10 7 6 10 41 41 45 33 31 26 43 38 29 37 24 9 44 33 28 51 12 15 17 2 6 26 18 13 12 42 26 24 65 32 42 26 23 39 69 0.296 0.316 0.332 0.308 0.300 0.298 0.331 0.323 0.327 0.325 0.291 0.303 0.305 0.330 0.294 8 15 13 16 15 17 10 15 15 2 9 3 4 5 2 8 5 5 10 2 4 16 22 14 17 24 6 11 20 18 7 21 12 11 21 12 57 33 30 57 37 50 56 29 46 24 44 35 29 23 56 Question 2 Part 2 Using the coefficient estimates from the previous regression model, manually calculate the predicted runs and prediction error for each observation. Then create a scatter plot of the Actual runs (Y-axis) against the Predicted runs (X-axis). Actual Runs Predicted Runs Prediction Error 46 22 57 46 21 20 49 Place Chart Here! 65 64 26 35 21 36 34 44 20 48 38 20 22 21 33 38 48 38 20 22 21 33 38 45 49 66 25 37 53 38 44 33 28 51 26 42 26 24 65 32 42 26 23 39 69 Runs Scored Doubles Triples Home runs Strike outs 9 2 5 10 46 22 57 46 16 13 14 18 4 20 12 4 2 21 20 49 65 64 1 12 11 17 14 10 40 32 32 35 49 20 33 60 30 17 10 19 3 7 5 8 26 13 1 25 7 18 20 14 10 2 51 31 57 9 8 7 Batting Average 0.295 0.299 0.292 0.306 0.320 0.341 0.297 0.292 0.320 0.280 0.348 0.291 0.303 0.293 0.293 0.342 0.296 0.320 0.344 0.291 0.295 0.329 0.291 0.325 0.292 0.300 0.308 0.298 0.302 0.296 10 12 16 8 25 27 29 30 38 35 21 36 34 44 20 48 38 20 22 21 33 38 45 49 66 25 37 53 38 1 5 9 9 5 9 2 3 9 10 37 42 10 5 21 13 16 9 23 14 9 6 16 8 11 6 18 17 23 14 15 8 10 17 13 15 13 11 15 9 9 11 1 4 10 5 10 7 6 10 41 41 45 33 31 26 43 38 29 37 24 9 44 33 28 51 12 15 17 2 6 26 18 13 12 42 26 24 65 32 42 26 23 39 69 0.296 0.316 0.332 0.308 0.300 0.298 0.331 0.323 0.327 0.325 0.291 0.303 0.305 0.330 0.294 8 15 13 16 15 17 10 15 15 2 9 3 4 5 2 8 5 5 10 2 4 16 22 14 17 24 6 11 20 18 7 21 12 11 21 12 57 33 30 57 37 50 56 29 46 24 44 35 29 23 56 Question 2 Part 2 Using the coefficient estimates from the previous regression model, manually calculate the predicted runs and prediction error for each observation. Then create a scatter plot of the Actual runs (Y-axis) against the Predicted runs (X-axis). Actual Runs Predicted Runs Prediction Error 46 22 57 46 21 20 49 Place Chart Here! 65 64 26 35 21 36 34 44 20 48 38 20 22 21 33 38 48 38 20 22 21 33 38 45 49 66 25 37 53 38 44 33 28 51 26 42 26 24 65 32 42 26 23 39 69