Answered step by step
Verified Expert Solution
Link Copied!

Question

1 Approved Answer

QUESTION 2 Regression and Correlation: The following table shows the relationship between the amount of time studying and the G.P.A. of 7 students in the
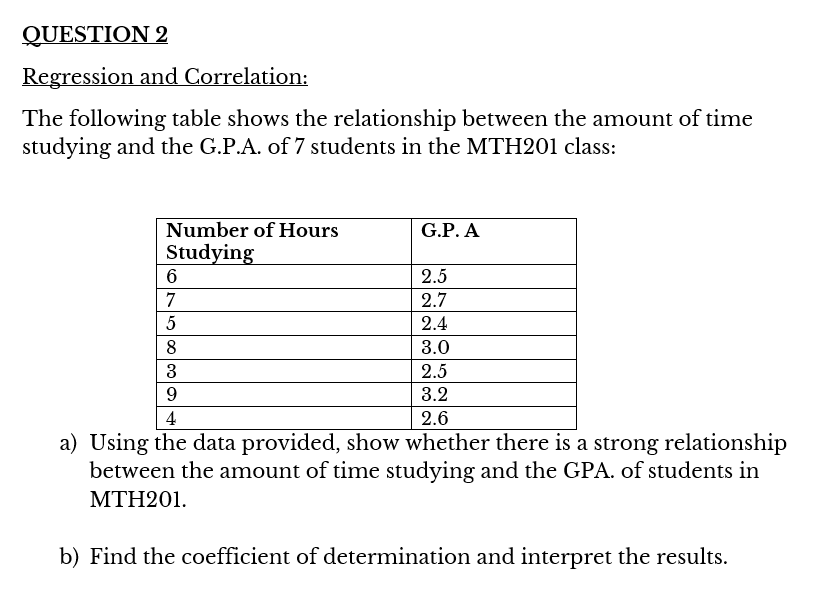
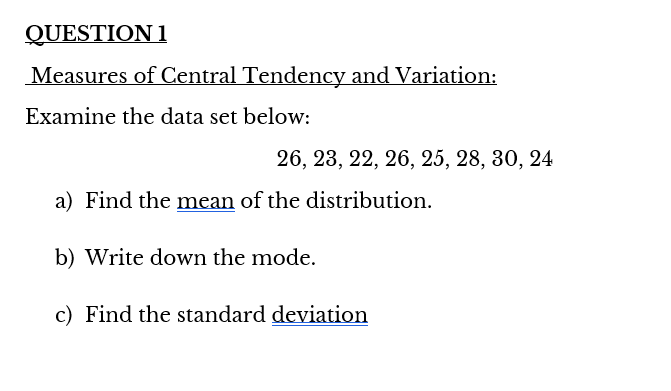
image text in transcribedimage text in transcribed
QUESTION 2 Regression and Correlation: The following table shows the relationship between the amount of time studying and the G.P.A. of 7 students in the MTHZ201 class: Number of Hours Studyin 4 2:6 a) Using the data provided, show whether there is a strong relationship between the amount of time studying and the GPA. of students in MTH20L1. b) Find the coefficient of determination and interpret the results. QUESTION 1 Measures of Central Tendency and Variation: Examine the data set below: 26, 23, 22, 26, 25, 28, 30, 24 a) Find the mean of the distribution. b) Write down the mode. c) Find the standard deviation

Step by Step Solution

There are 3 Steps involved in it

Step: 1

blur-text-image

Get Instant Access to Expert-Tailored Solutions

See step-by-step solutions with expert insights and AI powered tools for academic success

Step: 2

blur-text-image_2

Step: 3

blur-text-image_3

Ace Your Homework with AI

Get the answers you need in no time with our AI-driven, step-by-step assistance

Get Started

Recommended Textbook for

Elementary Statisitcs

Authors: Barry Monk

2nd edition

1259345297, 978-0077836351, 77836359, 978-1259295911, 1259295915, 978-1259292484, 1259292487, 978-1259345296

More Books

Students also viewed these Mathematics questions