

Answered step by step
Verified Expert Solution
Question
1 Approved Answer
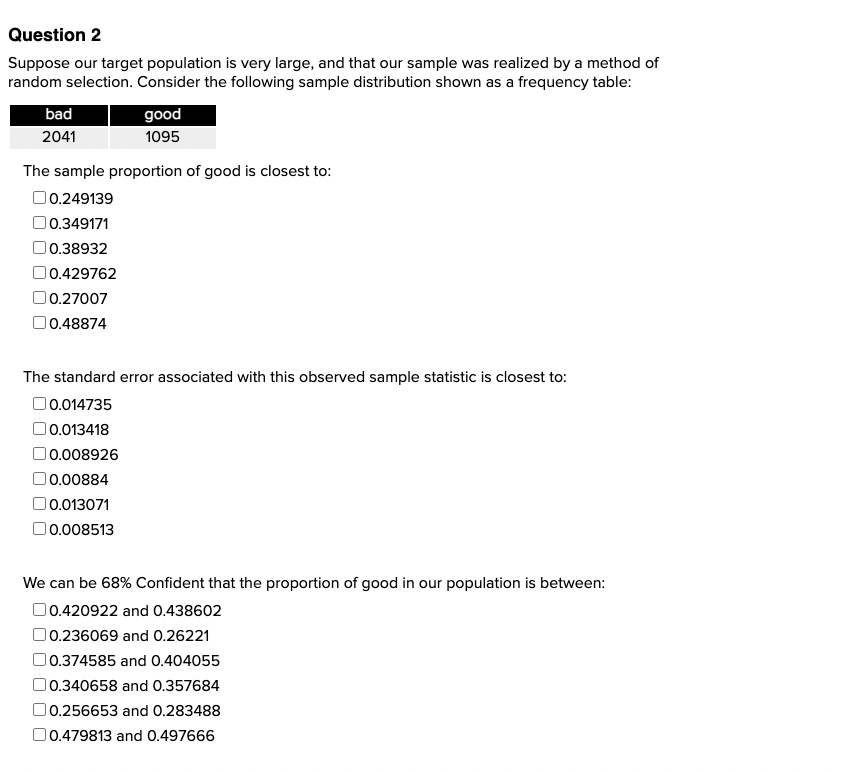
Question 2 Suppose our target population is very large, and that our sample was realized by a method of random selection. Consider the following sample
Step by Step Solution
There are 3 Steps involved in it
Step: 1

Get Instant Access to Expert-Tailored Solutions
See step-by-step solutions with expert insights and AI powered tools for academic success
Step: 2

Step: 3
Ace Your Homework with AI
Get the answers you need in no time with our AI-driven, step-by-step assistance
Get Started
Mathematics For Liberal Arts Majors
Authors: Christopher Thomas
1st Edition
0071544305, 9780071544306