QUESTION 2
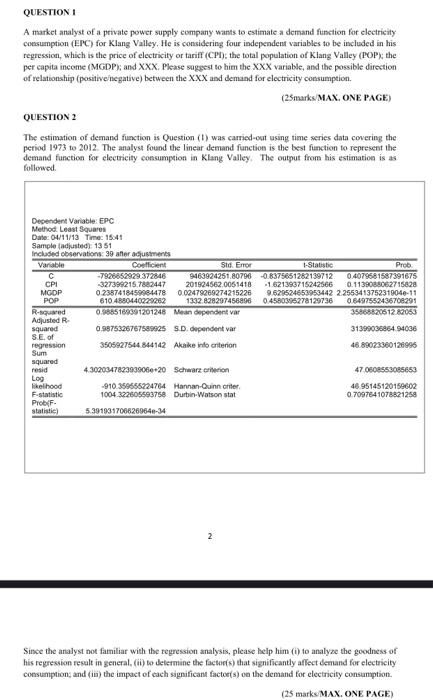
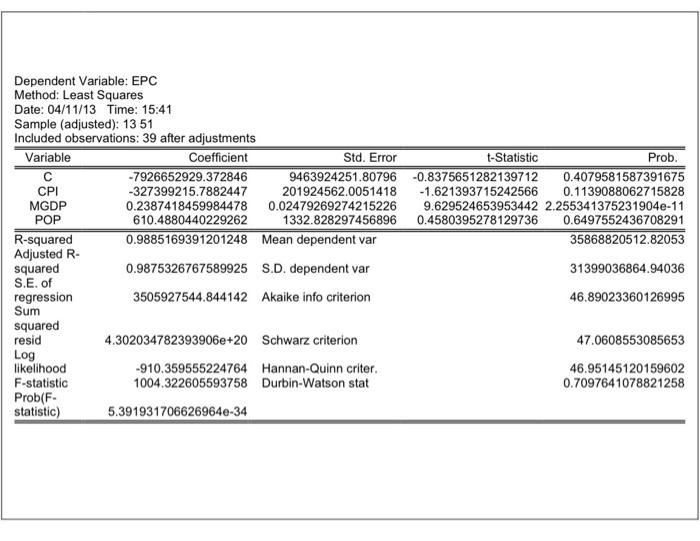
The estimation of demand function is Question (1) was carried-out using time series data covering the period 1973 to 2012. The analyst found the linear demand function is the best function to represent the demand function for electricity consumption in Klang Valley. The output from his estimation is as followed.
Since the analyst not familiar with the regression analysis, please help him (i) to analyze the goodness of his regression result in general, (ii) to determine the factor(s) that significantly affect demand for electricity consumption; and (iii) the impact of each significant factor(s) on the demand for electricity consumption.
QUESTION A market analyst of a private power supply company wants to estimate a demand function for electricity consumption (EPC) for Klang Valley. He is considering four independent variables to be included in his regression, which is the price of electricity or tariff (CPI), the total population of Klang Valley (POP): the per capita income (MGDP), and XXX. Please suggest to him the XXX variable, and the possible direction of relationship (positiveegative) between the XXX and demand for electricity consumption. (2Smarks/MAX, ONE PAGE) QUESTION 2 The estimation of demand function is Question (1) was carried out using time series data covering the period 1973 to 2012. The analyst found the linear demand function is the best function to represent the demand function for electricity consumption in Klang Valley. The output from his estimation is as followed Dependent Variable: EPC Method. Least squares Date: 04/11/13 Time: 15.41 Sample (adjusted: 13 51 Included observations: 39 after adjustments Variable Coefficient Std. Error 1-Statistic Preb -7926652929.372846 9463924251,80796 08375661262739712 0.4079681587391675 CPI 327396215.7882447 201924562.00514181621393715242566 0.1139088082715828 MGOP 0.2387418459984478 0.02479269274215226 9.629524653953442 2.256341375231904-11 POP 610 488044022202 1332.828297456806 0.4580395278129736 0.6497552436708291 R-squared 0.9885188391201248 Meandependent var 3586502061262053 Adjusted R squared 0.98753267675898925 SD. dependent var 31399036864.94036 SE of regression 3505427544 844142 Akake into criterion 46.89023360128995 Sum squared 4302034782393906e-20 Schwarz criterion 470608553085653 likelihood -910.359656224764 Hanna-Quinn criter 46.95145120159602 Fstatistic 1004 322605593758 Durbin-Watson stat 07097641078821258 Prob. statistic 5.3919317066269640-34 resid 09 2 Since the analyst not familiar with the regression analysis, please help him (6) to analyze the goodness of his regression result in general, (ii) to determine the factors that significantly affect demand for electricity consumption, and (ii) the impact of each significant factor(s) on the demand for electricity consumption (25 marks MAX. ONE PAGE) Dependent Variable: EPC Method: Least Squares Date: 04/11/13 Time: 15:41 Sample (adjusted): 1351 Included observations: 39 after adjustments Variable Coefficient Std. Error t-Statistic Prob. -7926652929.372846 9463924251.80796 -0.8375651282139712 0.4079581587391675 CPI -327399215.7882447 201924562.0051418 -1.621393715242566 0.1139088062715828 MGDP 0.2387418459984478 0.02479269274215226 9.629524653953442 2.255341375231904e-11 POP 610.4880440229262 1332.828297456896 0.4580395278129736 0.6497552436708291 R-squared 0.9885169391201248 Mean dependent var 35868820512.82053 Adjusted R- squared 0.9875326767589925 S.D. dependent var 31399036864.94036 S.E. of regression 3505927544.844142 Akaike info criterion 46.89023360126995 Sum squared resid 4.302034782393906e+20 Schwarz criterion 47.0608553085653 Log likelihood -910.359555224764 Hannan-Quinn criter. 46.95145120159602 F-statistic 1004.322605593758 Durbin-Watson stat 0.7097641078821258 Prob(F. statistic) 5.391931706626964e-34