

Answered step by step
Verified Expert Solution
Question
1 Approved Answer
Question 2 Using Matlab Now let's explore what happens if you change the parameters a or b . Plot 3 different versions of y '
Question Using Matlab
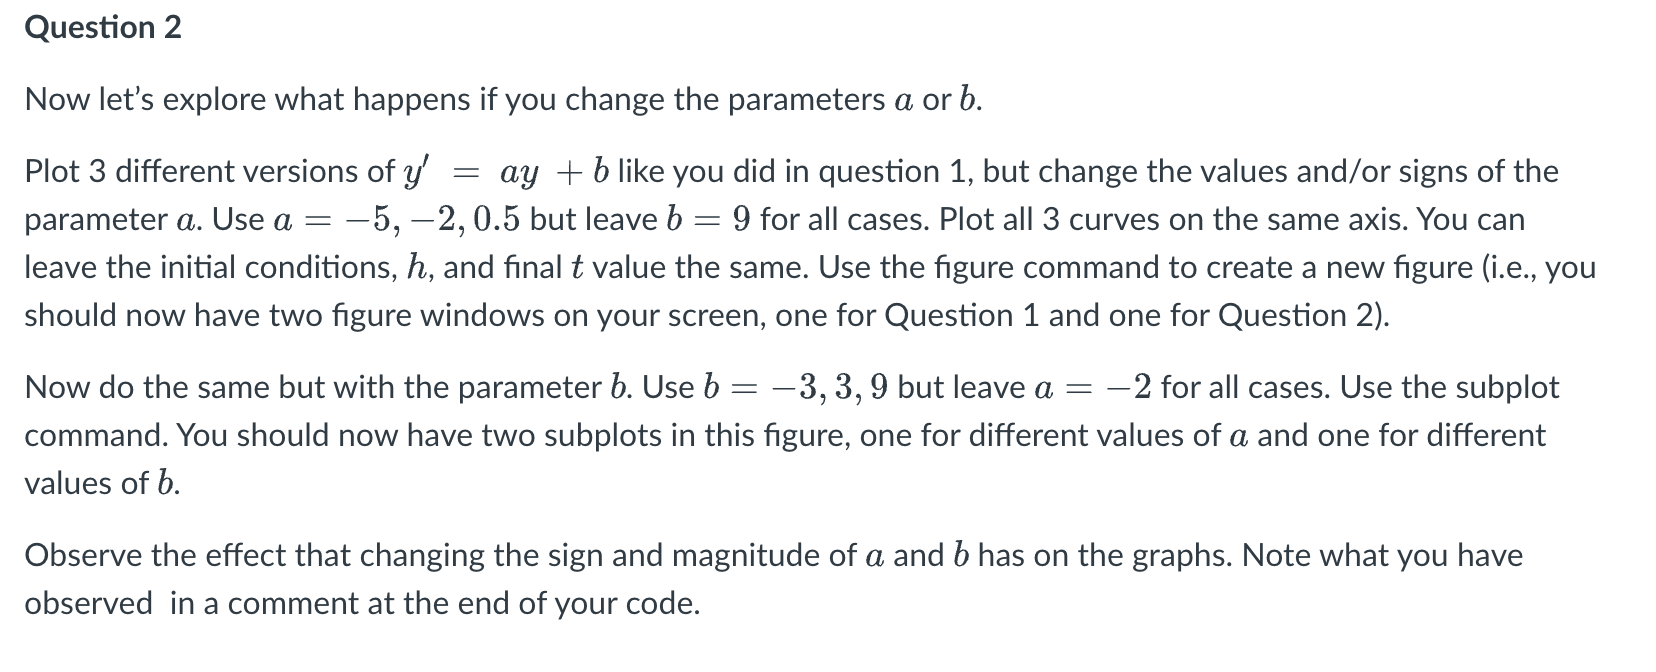
Now let's explore what happens if you change the parameters or
Plot different versions of like you did in question but change the values andor signs of the
parameter Use but leave for all cases. Plot all curves on the same axis. You can
leave the initial conditions, and final value the same. Use the figure command to create a new figure ie you
should now have two figure windows on your screen, one for Question and one for Question
Now do the same but with the parameter Use but leave for all cases. Use the subplot
command. You should now have two subplots in this figure, one for different values of a and one for different
values of
Observe the effect that changing the sign and magnitude of a and has on the graphs. Note what you have
observed in a comment at the end of your code.
Step by Step Solution
There are 3 Steps involved in it
Step: 1

Get Instant Access to Expert-Tailored Solutions
See step-by-step solutions with expert insights and AI powered tools for academic success
Step: 2

Step: 3
Ace Your Homework with AI
Get the answers you need in no time with our AI-driven, step-by-step assistance
Get Started
SQL Server Query Performance Tuning
Authors: Sajal Dam, Grant Fritchey
4th Edition
1430267429, 9781430267423