

Answered step by step
Verified Expert Solution
Question
1 Approved Answer
QUESTION: 2016 2017 Current ratio Quick ratio Total Assets Turnover Total Debt Ratio Debt-Equity Ration Depont Identity Long-term Debt Ratio Times Interest Ratio Cash-coverage ratio
QUESTION:
|
| 2016 | 2017 |
| Current ratio |
|
|
| Quick ratio |
|
|
| Total Assets Turnover |
|
|
| Total Debt Ratio |
|
|
| Debt-Equity Ration |
|
|
| Depont Identity |
|
|
| Long-term Debt Ratio |
|
|
| Times Interest Ratio |
|
|
| Cash-coverage ratio |
|
|
| Profit Margin |
|
|
| Return on Assets |
|
|
| Price Earning Ration |
|
|
| Market to Book ration |
|
|
n) Calculate the Earning per shares?
o) Calculate is the Dividend per share?
p) Calculate the Du Pont Identity?
q) What does the Du Pont identity tell you about the company?
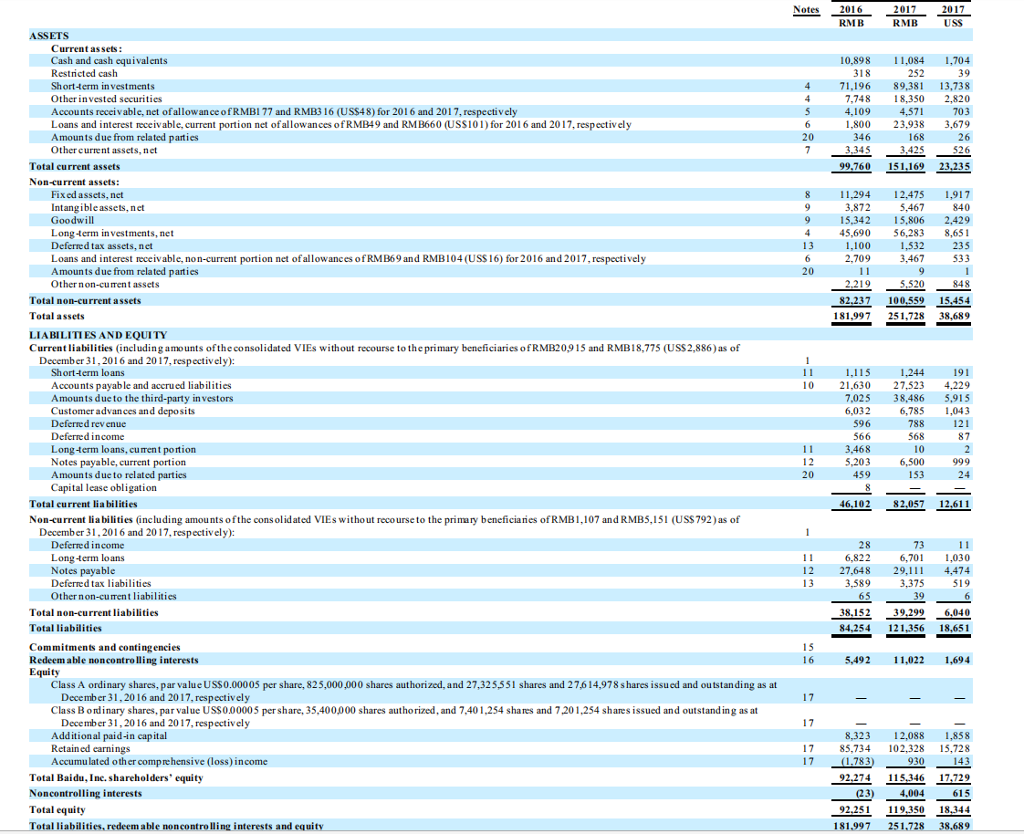
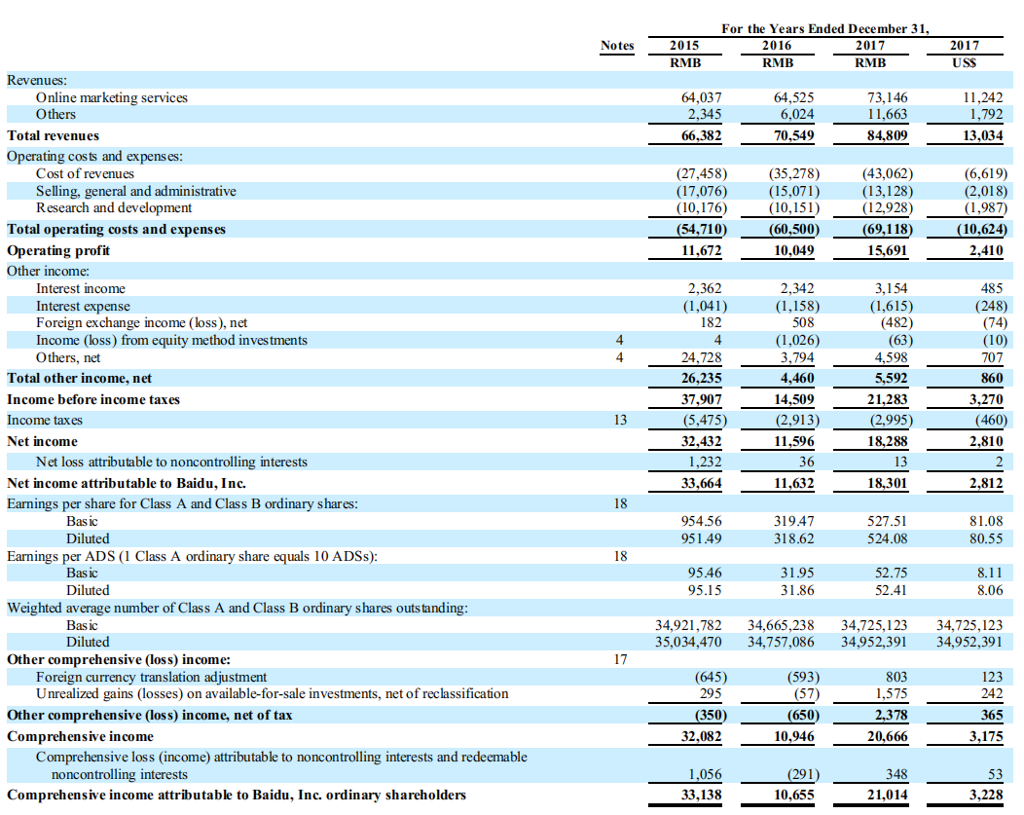
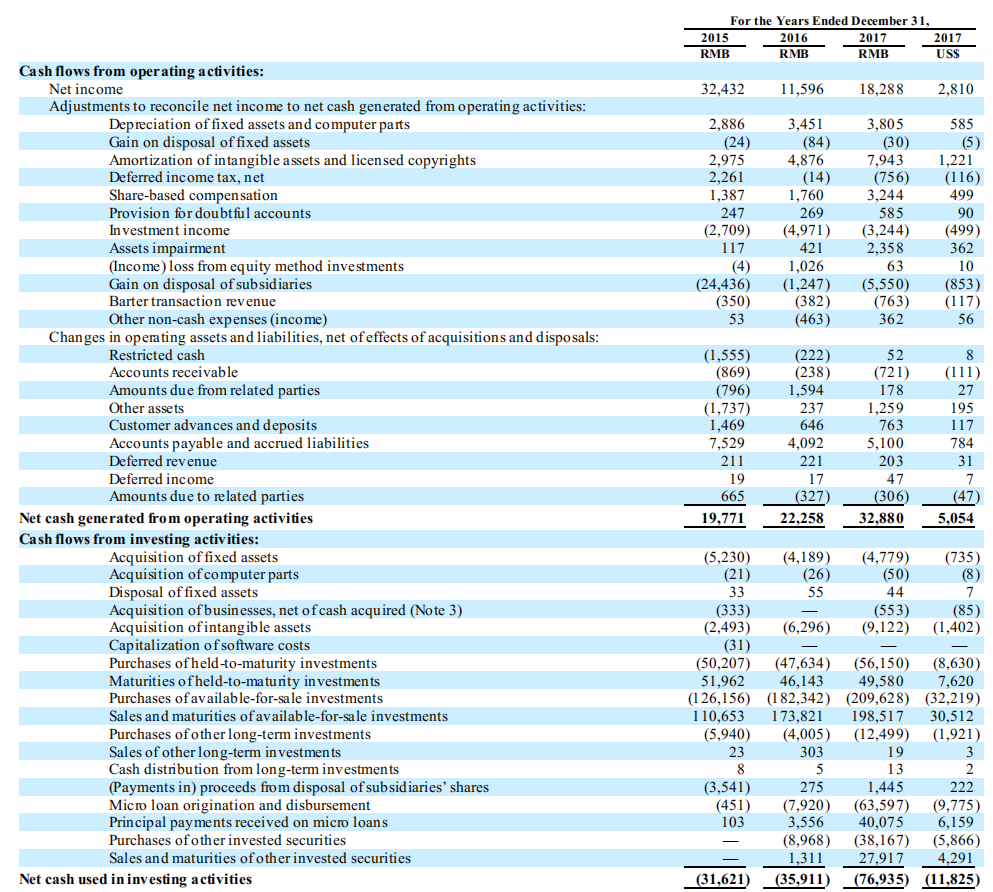
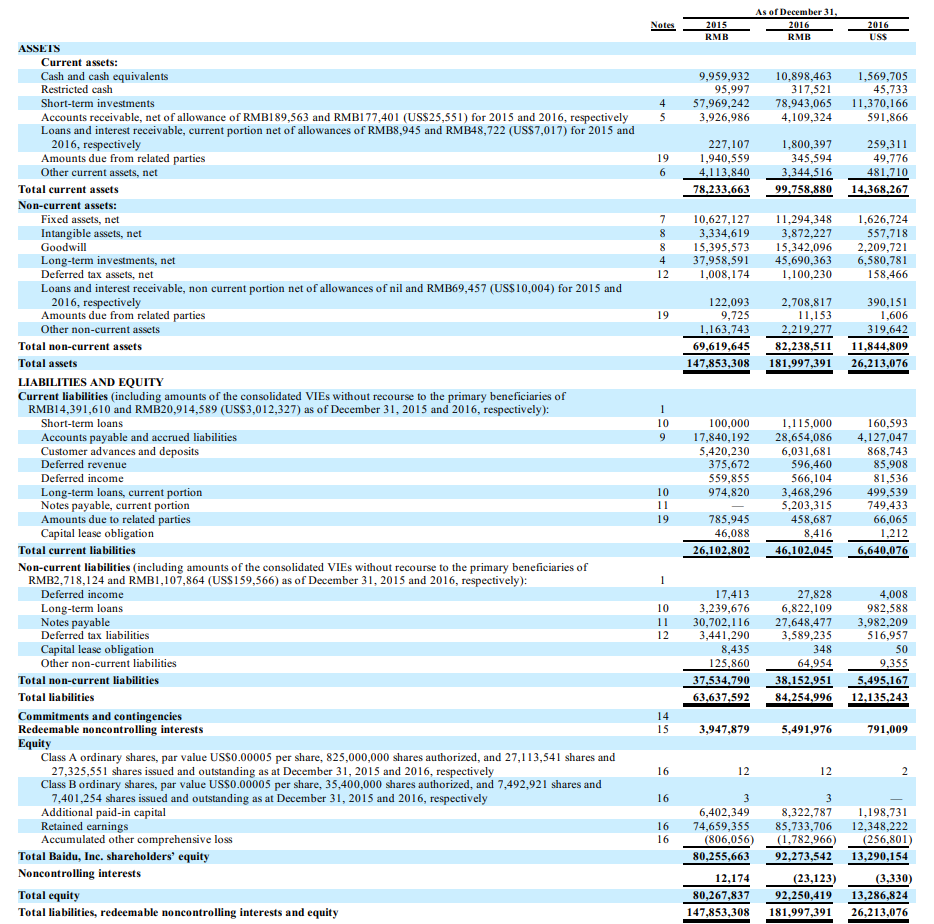
Notes 206 RMB RMB ASSETS Current assets: Cash and cash equivalents Restricted cash Short-term investments Otherinvested securities Accounts receivable, net of allowance of RMB1 77 and RMB3 16 (USS48) for 201 6 and 2017, respectively Loans and interest receivable, current portion net ofallowances ofRMB49 and RM B660 (USS101) for 201 6 and 2017, respectively Amounts due from related parties Other current assets, net 10,898 ,084 1,704 252 4 71,196 89,381 13,738 7,748 8,350 2,820 4,109 4,571 703 1.800 23,938 3.679 15 36 Total current assets Non-current assets: 99.760 151169 23.235 Fixed assets, net Intangibleassets, net Goodwill Long-term in vestments,net Deferred tax assets, net Loans and interest receivable, non-current portion net ofallowances of RMB69 and RMB104 (USS 16) for 2016 and 2017, respectively Amounts due from related parties Othernon-current assets 8 11,294 12,475 1,917 3.872 5.467 9 15,342 15,806 2.429 5,690 56,283 8,651 1,100 1,532 235 2,709 3.467 533 Total non-current assets Total assets LIABILITIES AND EQUITY Current liabilities (including amounts oftheconsolidated VIEs without recourse to the primary beneficiaries ofRMB20915 and RMB18,775 (USS2,886)as of 82.237 100.559 15.454 181,997 251,728 38,689 December 31,2016 and 2017, respectively): Short-term loans Accounts payable and accrued liabilities Amounts due to the third-party in vestors Customer advances and deposits Deferred rev enue Deferred income Long-term loans, curent portion Notes payable, current portion Amounts due to related parties Capital lease obligation 10 21.630 27.523 4.229 7,025 38,486 5,915 6,785 1,043 6,032 788 568 3.468 5,203 459 6,500 1S3 Total current lia bilities 46,102 82,057 12,611 Non-current liabilities (including amounts ofthe cons olidated VIEs witho ut reco urseto the primary beneficianies of RMB1,107 and RMB5,151 (USS792)as of December 31,2016 and 2017, respectively): Deferred income Long term loans Notes payable Deferred tax liabilities Other non-current liabilities 73 6,822 12 27,648 29,1 4,474 Total non-current liabilities Total liabilities Commitments and conting encies Redeem able noncontrolling interests 38,152 39.299 6,040 84,254 21356 18,651 5,492 1,022 1,694 Class A ordinary shares, par value US$0.00005 per share, 825,000,000 shares authorized, and 27,325551 shares and 27614,978 s hares issued and outstanding as at December 31.2016 and 2017, respectively Class B ordinary shares, par value USS000005 per share, 35,400000 shares authorized, and 7.401,254 shares and 7201,254 shares issued and outstand ing as at December 31,2016 and 2017, respectively Additional paid-in capital Retained earnin Accumu lated oth er comprehensive (loss)income 8,323 12,088 1,858 17 85,734 102,328 15.728 17 (1.783)93014 Total Baidu, Ine. shareholders' equity Noncontrolling interests Total equity Total liabilities, redeem able noncontrolling interests and equitv 92.274115.346 17.729 (23) 4,004 92.251 119.350 18.344 181.997 251.728 38.689 For the Years Ended December 31 Notes 2017 2015 RMB 2017 RMB RMB Revenues Online marketing services Others 64,037 2,345 66,382 64,525 6,024 70,549 73,146 11,663 84,809 11,242 Total revenues Operating costs and expenses Cost of revenues Selling, general and administrative Research and development (43,062) (13,128) (12,928) 69,118 15,691 (6,619) (2,018) (1,987) (27,458) (35,278) (17,076) 10,176 (15,071) 0,151) (54.710(60.500)(69 Total operating costs and expens es Operating profit Other income: 11,672 10,049 2,362 Interest income Interest expense Foreign exchange income (loss), net Income (loss) from equity method investments Others, net 2,342 485 1,041) 182 4 1.026) 4 4 Total other income, net Income before income taxes Income taxes Net income 26,235 37,907 (5,475) 32,432 59 3,270 (460) 2.810 13 995) (2,913) 596 18,288 13 18,301 Net loss attributable to noncontrolling interests Net income attributable to Baidu, Inc. 33,664 Earnings per share for Class A and Class B ordinary shares 18 954.56 951.49 31947 318.62 527.51 524.08 Diluted 80.55 Earnings per ADS (1 Class A ordinary share equals 10 ADSs): 95 46 52.75 52.41 Diluted Weighted average number of Class A and Class B ordinary shares outstanding 34,921,782 34,665,238 34,725,12334,725,123 35,034,470 34,757,086 34,952,391 34,952,391 Diluted Other comprehensive (loss) income: 17 (593) 803 123 Foreign currency translation adjustment Unrealized gains (losses) on available-for-sale investments, net of reclassification (645) (57) 650) Other comprehensive (loss) income, net of tax Comprehensive income 2,378 20,666 32,082 10,946 Comprehensive loss (income) attributable to noncontrolling interests and redeemable noncontrolling interests Comprehensive income attributable to Baidu, Inc. ordinary shareholders 33,138 10,655 3,228 For the Years Ended December 31 RMB RMB Cash flows from operating activities: 32,432 11,596 18,288 2,810 585 7,943 ,221 499 (2,709) (4,971) 3,244) 499) Net income Adjustments to reconcile net income to net cash generated from operating activities: Depreciation of fixed assets and computer parts Gain on disposal of fixed assets Amortization of intangible assets and licensed copyrights 2,886 3,451 3,805 2,975 4,876 income tax, net (756) (116) Share-based compen sation Provision for doubtful accounts Investment income Assets impairment (Income)loss from equity method investments Gain on disposal of subsidiaries Barter transaction revenue Other non-cash expenses (income) 269 585 362 (4) ,026 (24,436) (,247) (5,550) (853) (382) (463) (350) (763) (117) 362 Changes in operating assets and liabilities, net of effects of acquisitions and disposals Restricted cash Accounts receivable Amounts due from related parties Other assets Customer advances and deposits Accounts payable and accrued liabilities Deferred revenue Deferred income Amounts due to related parties (1,555) 869) (796) (1,737) 1,469 7,529 (721) 238) 1,594 237 195 1,259 763 4,092 784 203 19 665 327) 306 19,771 32,880 Net cash generated from operating activities Cash flows from investing activities: 58 Acquisition of fixed assets Acquisition ofcomputer parts Disposal offixed assets Acquisition ofbusinesses, net of cash acquired (Note 3) Acquisition of intangible assets Capitalization of software costs Purchases ofheld-to-maturity investments Maturities ofheld-to-maturity in vestments Purchases ofavailable-for-sa le investments Sales and maturities of available-for-sa le investments Purchases of other long-term investments Sales of other long-term in vestments Cash distribution from long-term investments (Payments in) proceeds from disposal of subsidiaries' shares Micro loan origination and disbursement Principal payments received on micro loans Purchases of other invested securities Sales and maturities ofother invested securities (5,230) (4,189) (4,779) (735) (553) (2,493) (6,296) (9,122) (1,402) 50,207) (47,634) (56,150) (8,630) 51,962 46,143 49,580 7,620 (126.156) (182,342) (209,628) (32,219) 110,653 173,821 198,517 30,512 (5,940) (4,005) (12,499) (1,921) 303 (3,541) (451) (7,920) (63,597) (9,775) 3,556 40,075 6,159 (8,968)(38,167) (5,866) 27,917 Net cash used in investing activities (31,621) (35,911) (76,935) (11,825) As of December 31 RMB RMB ASSE IS Current assets: Cash and cash equivalents Restricted cash Short-term investments Accounts receivable, net of allowance of RMB189,563 and RMB177,401 (US$25,551) for 2015 and 2016, respectively Loans and interest receivable, current portion net of allowances of RMB8,945 and RMB48,722 (US$7,017) for 2015 and 9,959,932 10,898,463 ,569,705 95,997 45,733 4 57,969,242 78,943,065 ,370,166 3,926,986 4,109,324 259,311 49,776 Amounts due from related parties Other current assets, net 1,940,559 Total current assets Non-current assets: 78,233,663 99.758,880 14.368,267 710,627,127294,348 626,724 557,718 8 15,395,57315,342,0962,209,721 4 37,958,591 45,690,363 6,580,781 Intangible assets, net 3,334,619 3,872,227 Long-term investments, net Deferred tax assets, net Loans and interest receivable, non current portion net of allowances of nil and RMB69,457 (USS 10,004) for 2015 and 1,008,174 2016, respectively Amounts due from related parties Other non-current assets 122,093 9,725 2,708,817 390,151 Total non-current assets 69,619,645 82.238.511 11.844,809 147,853,308 181.997,391 26.213,076 LIABILITIES AND EQUITY Current liabilities (including amounts of the consolidated VIEs without recourse to the primary beneficiaries of RMB14,391,610 and RMB20,914,589 (USS3,012,327) as of December 31, 2015 and 2016, respectively): Short-term loans Accounts payable and accrued liabilities Customer advances and deposits Deferred revenue Deferred income Long-term loans, current portion Notes payable, current portion Amounts due to related parties Capital lease obligation 00,000 1,115,000 31,681 566,104 9 17,840,192 28,654,086 4,127,047 868,743 420,230 375,672 559,855 974,820 10 499,539 749,433 5,203 458,687 46,088 Total current lia bilities -40:102.802 46.102.045 Non-current liabilities (including amounts of the consolidated VIEs without recourse to the primary beneficiaries of RMB2,718,124 and RMB1,107,864 (USS159,566) as of December 31, 2015 and 2016, respectively): Deferred income Long-term loans Notes payable 103,239,676 11 30,702,116 27,648,4773,982,209 6,822,109 Deferred tax liabilities 3,589 516,957 Capital lease obligation Other non-current liabilities 5.495,16 Total non-current liabilities Total liabilities Commitments and contingencies 37,534,790 63,637,592 38.152,951 84.254,996 12.135,243 14 Redeemable noncontrolling interests 947,879 5,491,976 791,009 uit Class A ordinary shares, par value USS0.00005 per share, 825,000,000 shares authorized, and 27,113,541 shares and 27,325.551 shares issued and outstanding as at December 31, 2015 and 2016, respectively Class B ordinary shares, par value USS0.00005 per share, 35,400,000 shares authorized, and 7,492,921 shares and 12 12 7,401,254 shares issued and outstanding as at December 31, 2015 and 2016, respectively Additional paid-in capital 8,322,787 ,198,731 16 74,659,355 85,733,706 12,348,222 (806,056 (,782,966 (256,801) 6,402,349 Accumulated other comprehensive loss Total Baidu, Inc. shareholders' equity Noncontrolling interests Total equity Total liabilities, redeemable noncontrolling interests and equity 80,255,663 92.273,542 13.290,154 (23,123) 80,267,837 92,250,419 13,286,824 147,853,308 181.997,39 26.213,076
Step by Step Solution
There are 3 Steps involved in it
Step: 1

Get Instant Access to Expert-Tailored Solutions
See step-by-step solutions with expert insights and AI powered tools for academic success
Step: 2

Step: 3
Ace Your Homework with AI
Get the answers you need in no time with our AI-driven, step-by-step assistance
Get Started