Question 26: Information about mutual funds provided by Morningstar Investment Research includes the type of mutual fund (Domestic Equity, International Equity, or Fixed Income) and the Morningstar rating for the fund. The rating is expressed from 1-star (lowest rating) to 5-star (highest rating). A sample of 25 mutual funds was selected from Morningstar Funds 500 (2008). The following counts were obtained:
? Sixteen mutual funds were Domestic Equity funds.
? Thirteen mutual funds were rated 3-star or less.
? Seven of the Domestic Equity funds were rated 4-star.
? Two of the Domestic Equity funds were rated 5-star.
Assume that one of these 25 mutual funds will be randomly selected in order to learn more about the mutual fund and its investment strategy.
a. What is the probability of selecting a Domestic Equity fund?
b. What is the probability of selecting a fund with a 4-star or 5-star rating?
c. What is the probability of selecting a fund that is both a Domestic Equity fund and a fund with a 4-star or 5-star rating?
d. What is the probability of selecting a fund that is a Domestic Equity fund or a fund with a 4-star or 5-star rating?
Question 32:
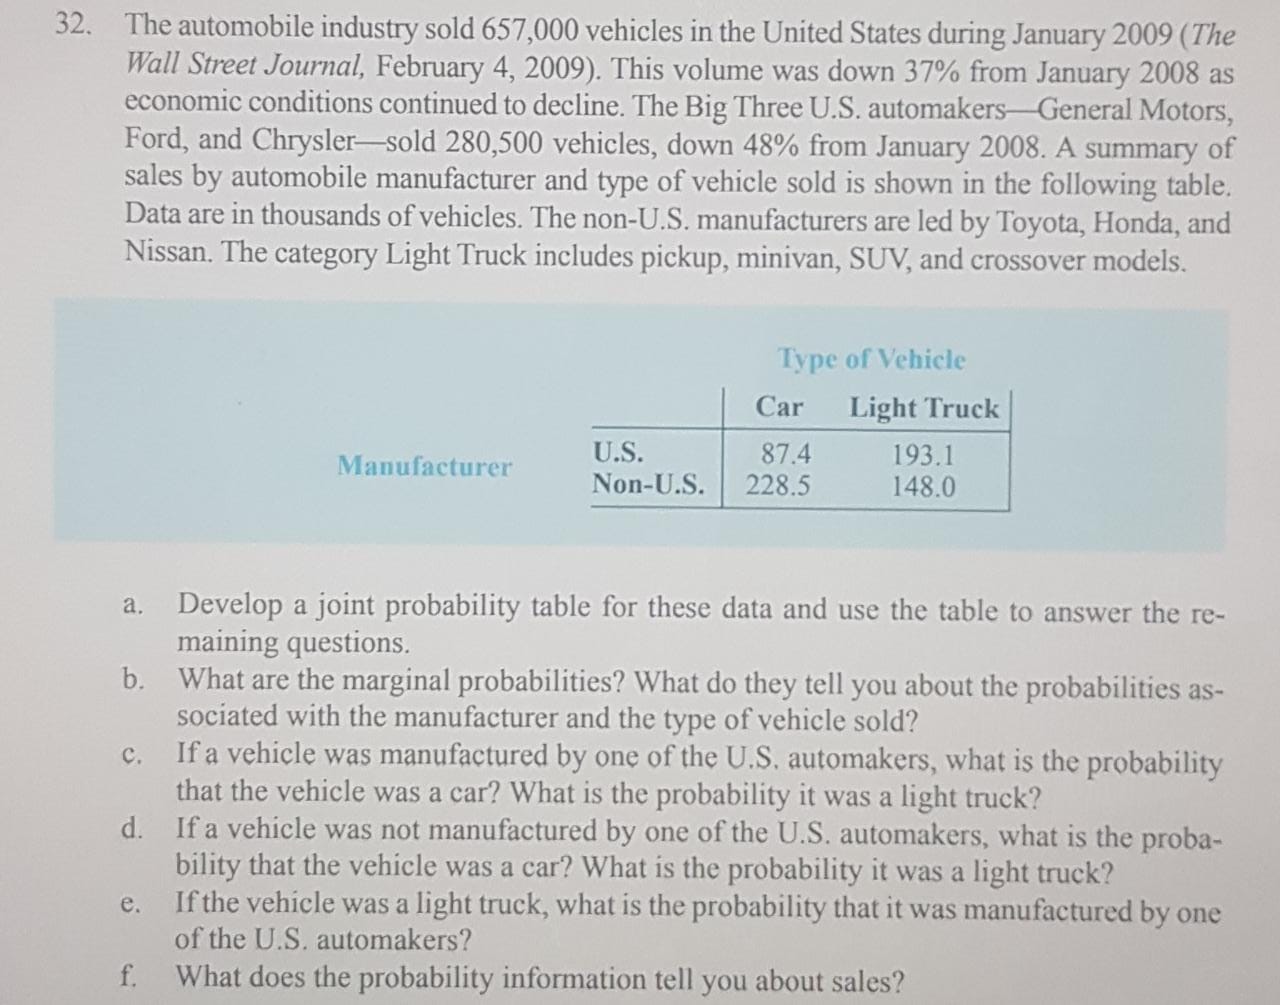
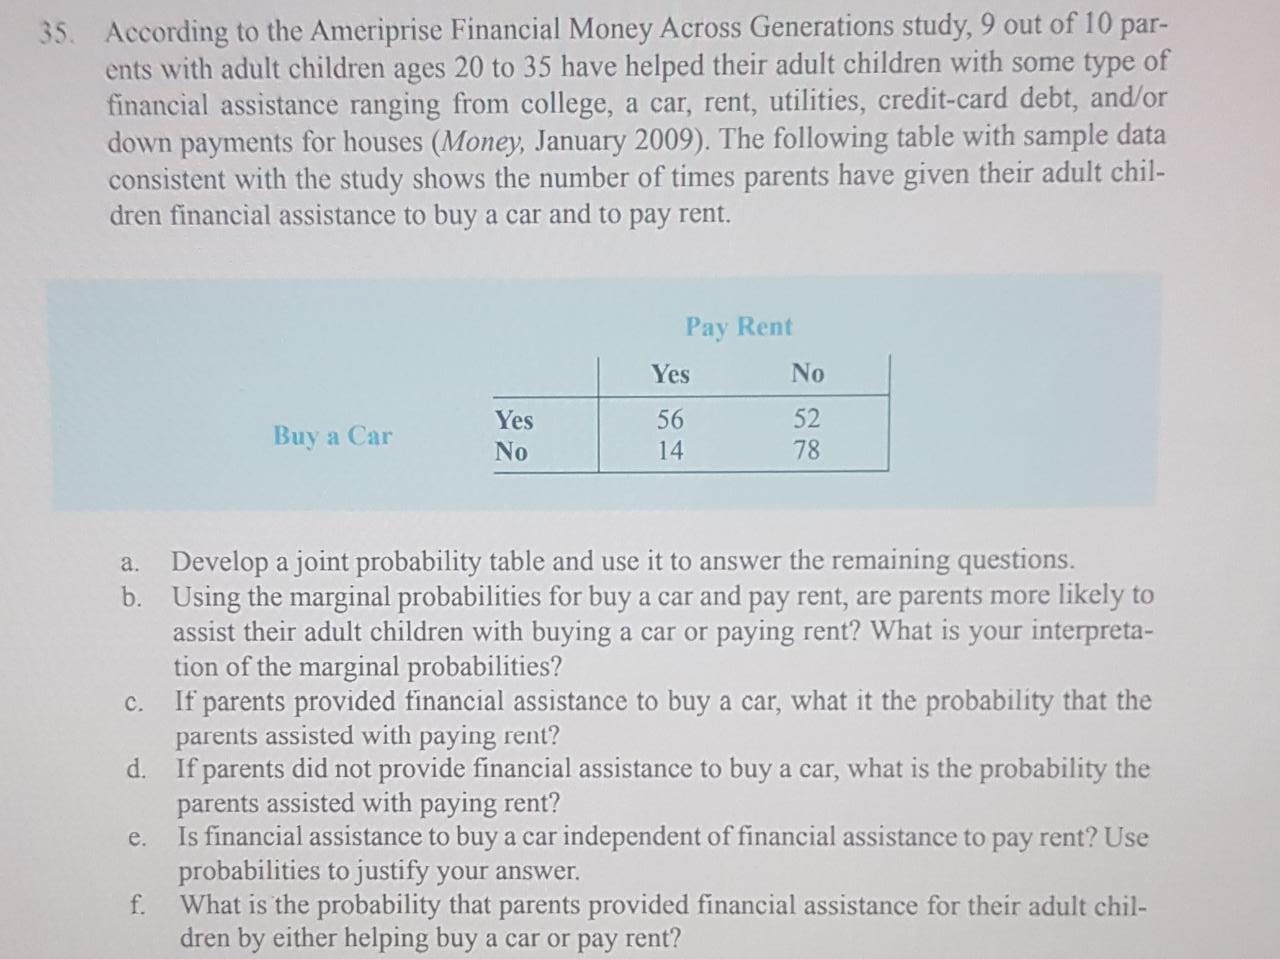
32. The automobile industry sold 657,000 vehicles in the United States during January 2009 (The Wall Street Journal, February 4, 2009). This volume was down 37% from January 2008 as economic conditions continued to decline. The Big Three U.S. automakers-General Motors, Ford, and Chrysler-sold 280,500 vehicles, down 48% from January 2008. A summary of sales by automobile manufacturer and type of vehicle sold is shown in the following table. Data are in thousands of vehicles. The non-U.S. manufacturers are led by Toyota, Honda, and Nissan. The category Light Truck includes pickup, minivan, SUV, and crossover models. Type of Vehicle Car Light Truck U.S. Manufacturer 87.4 193.1 Non-U.S. 228.5 148.0 a. Develop a joint probability table for these data and use the table to answer the re- maining questions. b. What are the marginal probabilities? What do they tell you about the probabilities as- sociated with the manufacturer and the type of vehicle sold? c. If a vehicle was manufactured by one of the U.S. automakers, what is the probability that the vehicle was a car? What is the probability it was a light truck? d. If a vehicle was not manufactured by one of the U.S. automakers, what is the proba- bility that the vehicle was a car? What is the probability it was a light truck? e. If the vehicle was a light truck, what is the probability that it was manufactured by one of the U.S. automakers? f. What does the probability information tell you about sales?35. According to the Ameriprise Financial Money Across Generations study, 9 out of 10 par- ents with adult children ages 20 to 35 have helped their adult children with some type of financial assistance ranging from college, a car, rent, utilities, credit-card debt, and/or down payments for houses (Money, January 2009). The following table with sample data consistent with the study shows the number of times parents have given their adult chil- dren financial assistance to buy a car and to pay rent. Pay Rent Yes No Yes 56 Buy a Car 52 No 14 78 a. Develop a joint probability table and use it to answer the remaining questions. b. Using the marginal probabilities for buy a car and pay rent, are parents more likely to assist their adult children with buying a car or paying rent? What is your interpreta- tion of the marginal probabilities? c. If parents provided financial assistance to buy a car, what it the probability that the parents assisted with paying rent? d. If parents did not provide financial assistance to buy a car, what is the probability the parents assisted with paying rent? e. Is financial assistance to buy a car independent of financial assistance to pay rent? Use probabilities to justify your answer. f. What is the probability that parents provided financial assistance for their adult chil- dren by either helping buy a car or pay rent


