Question 28 - of 30 Step 1 of 6 01:22:52 The table below gives the number of absences and the overall grade in the class
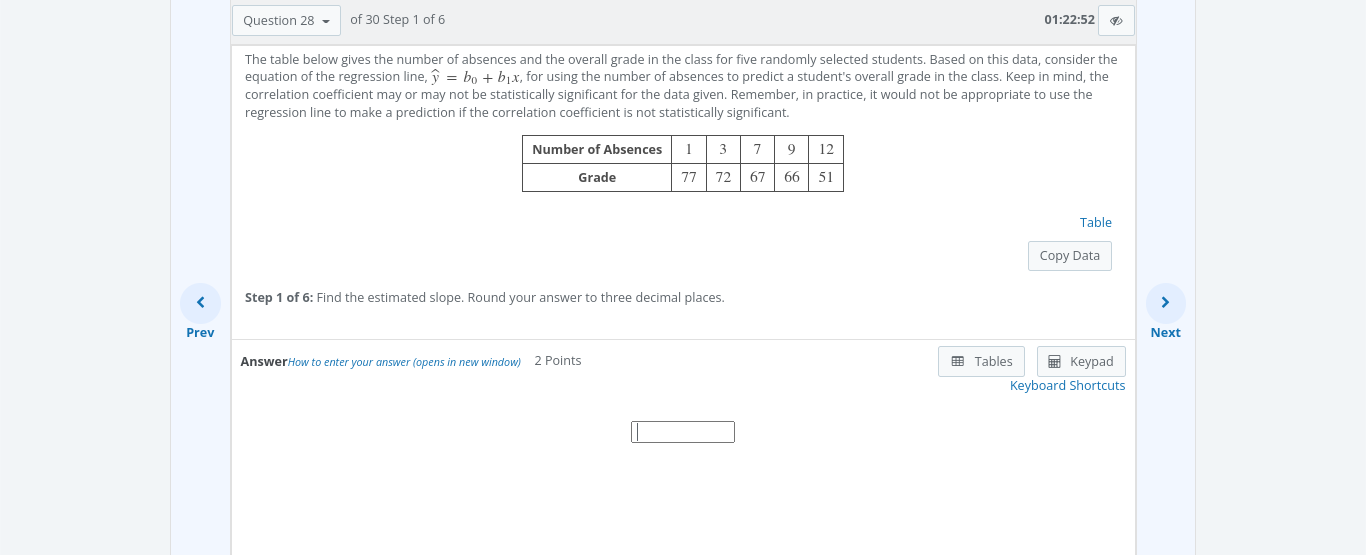
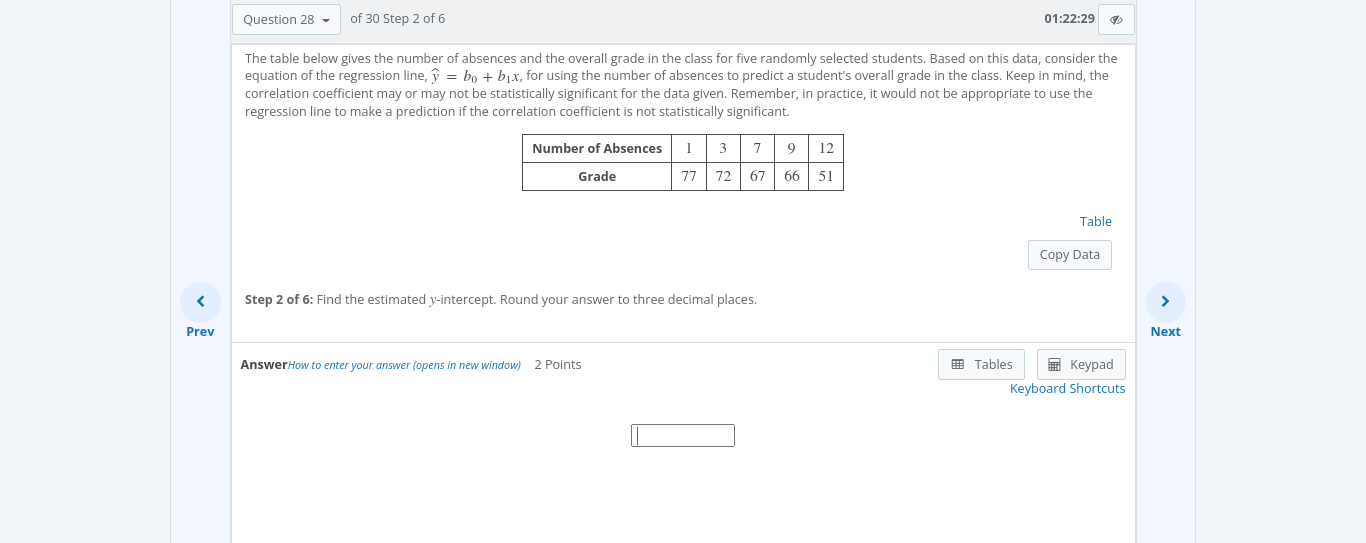
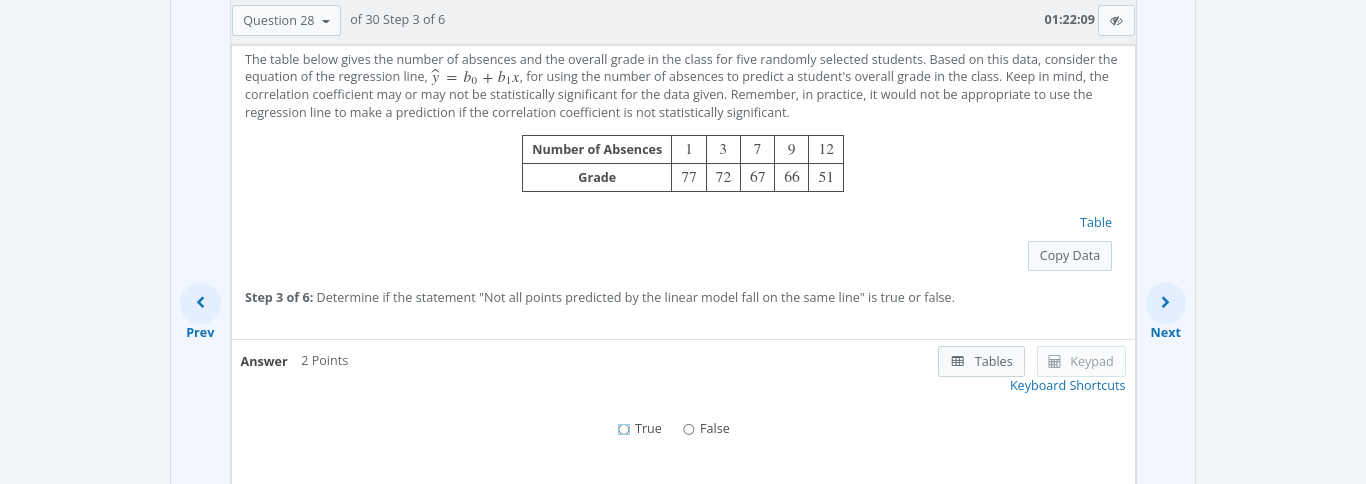
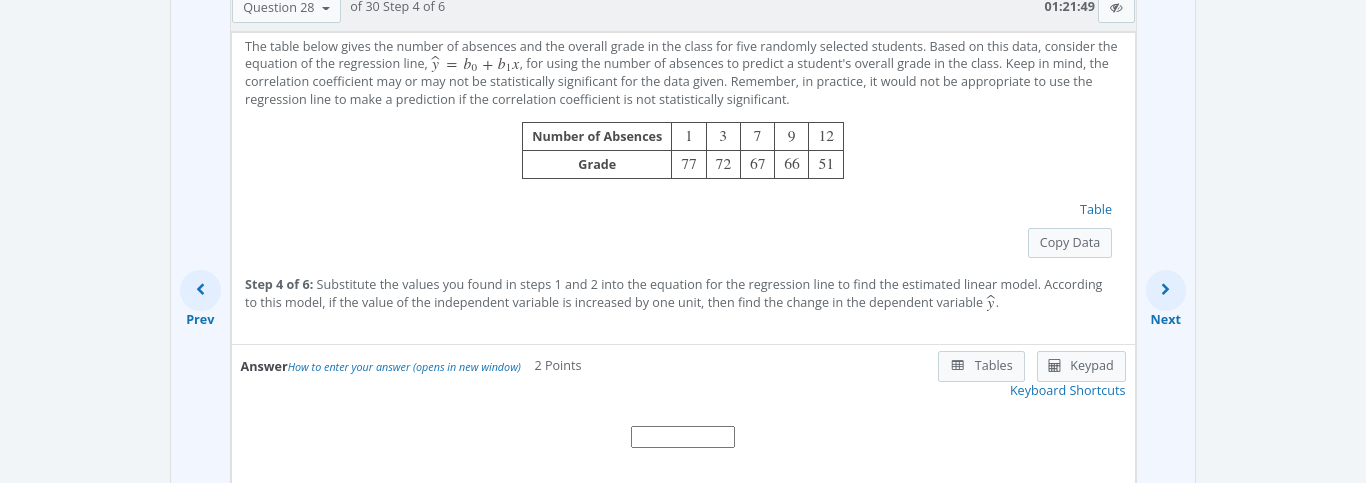
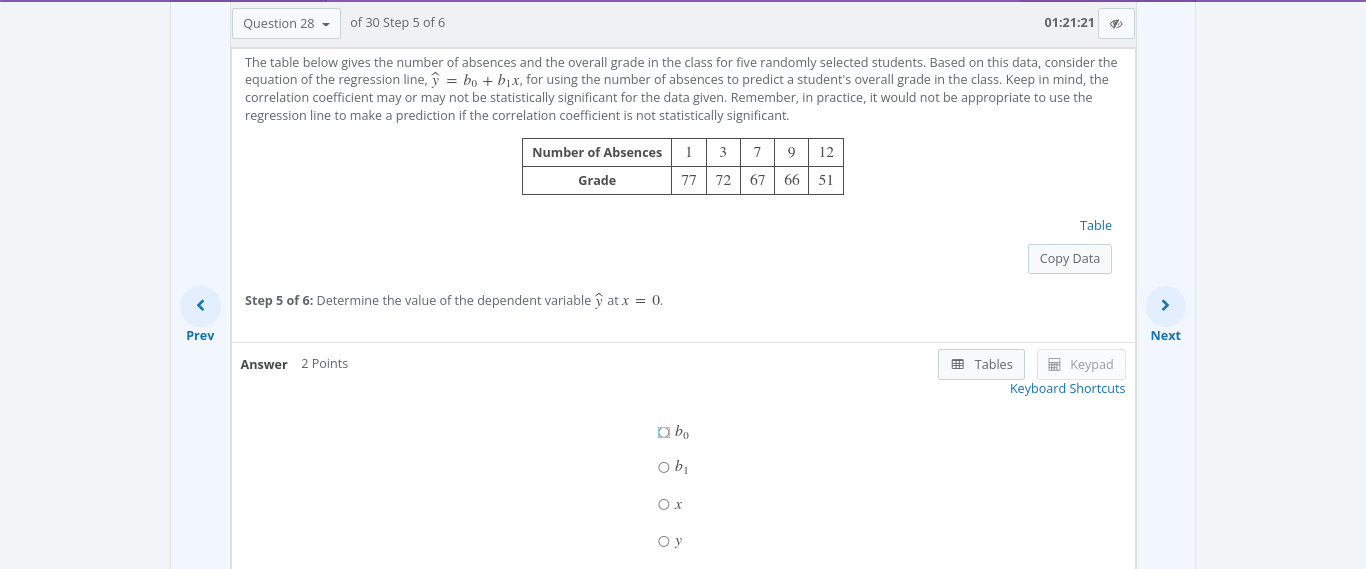
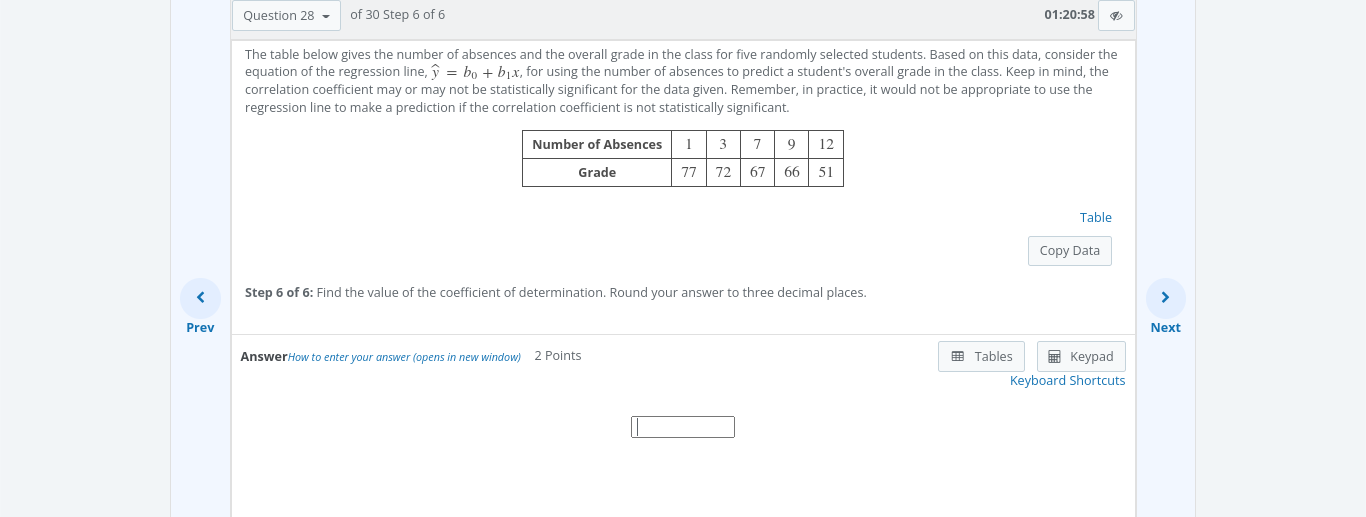
Question 28 - of 30 Step 1 of 6 01:22:52 The table below gives the number of absences and the overall grade in the class for five randomly selected students. Based on this data, consider the equation of the regression line, y = bo + bix, for using the number of absences to predict a student's overall grade in the class. Keep in mind, the correlation coefficient may or may not be statistically significant for the data given. Remember, in practice, it would not be appropriate to use the regression line to make a prediction if the correlation coefficient is not statistically significant. Number of Absences 3 7 12 Grade 77 72 67 66 51 Table Copy Data Step 1 of 6: Find the estimated slope. Round your answer to three decimal places. > Prev Next AnswerHow to enter your answer (opens in new window) 2 Points Tables Keypad Keyboard ShortcutsQuestion 28 - of 30 Step 2 of 6 01:22:29 The table below gives the number of absences and the overall grade in the class for five randomly selected students. Based on this data, consider the equation of the regression line, y = bo + bix, for using the number of absences to predict a student's overall grade in the class. Keep in mind, the correlation coefficient may or may not be statistically significant for the data given. Remember, in practice, it would not be appropriate to use the regression line to make a prediction if the correlation coefficient is not statistically significant. Number of Absences 3 7 12 Grade 77 72 57 66 51 Table Copy Data Prev Next AnswerHow to enter your answer (opens in new window) 2 Points Tables Keypad Keyboard ShortcutsQuestion 28 - of 30 Step 3 of 6 01:22:09 The table below gives the number of absences and the overall grade in the class for five randomly selected students. Based on this data, consider the equation of the regression line, y = bo + bix, for using the number of absences to predict a student's overall grade in the class. Keep in mind, the correlation coefficient may or may not be statistically significant for the data given. Remember, in practice, it would not be appropriate to use the regression line to make a prediction if the correlation coefficient is not statistically significant. Number of Absences 3 7 0 12 Grade 77 72 67 51 Table Copy Data Prev Next AnswerHow to enter your answer (opens in new window) 2 Points Tables Keypad Keyboard Shortcuts
Step by Step Solution
There are 3 Steps involved in it
Step: 1
Get Instant Access to Expert-Tailored Solutions
See step-by-step solutions with expert insights and AI powered tools for academic success
Step: 2
Step: 3
Ace Your Homework with AI
Get the answers you need in no time with our AI-driven, step-by-step assistance