

Answered step by step
Verified Expert Solution
Question
1 Approved Answer
Question 3 : 1 year s written as a single column with the R program who reads , then turns him into the matrix and
Question 3 : 1 year s written as a single column with the R program who reads , then turns him into the matrix and down ( . . . . . . ( . . . . . . . 7 . . . . . . ) . ) 1 year's hourly temperature data written as from the text file . Write the script from the cavity as the PDF . What is desired and below as desired as a lower - upper panel graph st - panel : Maximum and minimu that occur during the day draw as . [ 10P ] Alt - panel : Boxplot side by side every day of the year The time series for the whole year Draw the or day side by side to be boxplot . [ 10P ] 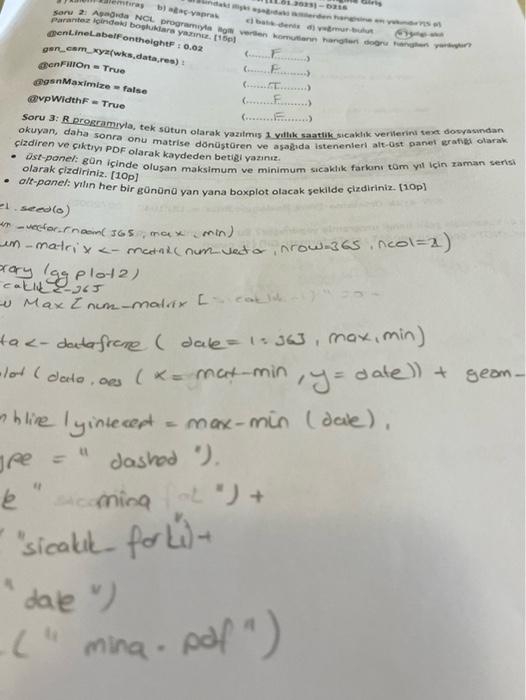
Soru 3: R programirla, tek sotun olarak yazitmis 1 yillik saatik, sicakhk verierini text dosyawndan okuyan, daha sonra onu matrise donstoren ve agagida istenenieri alt-0st panel grafigi olarak. cizdiren ve ciktiyi PDF olarak kaydeden betigi yaziniz. - Dst-paneri gan icinde olusan maksimum ve minimum sicaklik farkani tom yil icin raman sensi olarak cizdiriniz. [10p] - olt-panel: yilin her bir gununa yan yana boxplot olacak gekilde cizdiriniz. [1Op] - sered (o) 4n - vectar finain ( 365 ; max x min) en-matri x Step by Step Solution
There are 3 Steps involved in it
Step: 1

Get Instant Access to Expert-Tailored Solutions
See step-by-step solutions with expert insights and AI powered tools for academic success
Step: 2

Step: 3
Ace Your Homework with AI
Get the answers you need in no time with our AI-driven, step-by-step assistance
Get Started
Data And Information Quality Dimensions, Principles And Techniques
Authors: Carlo Batini, Monica Scannapieco
1st Edition
3319241060, 9783319241067