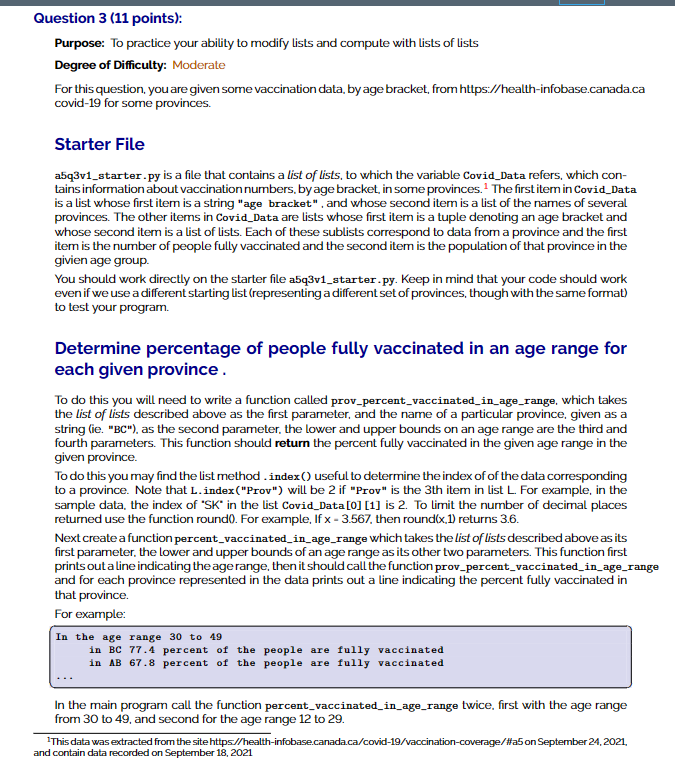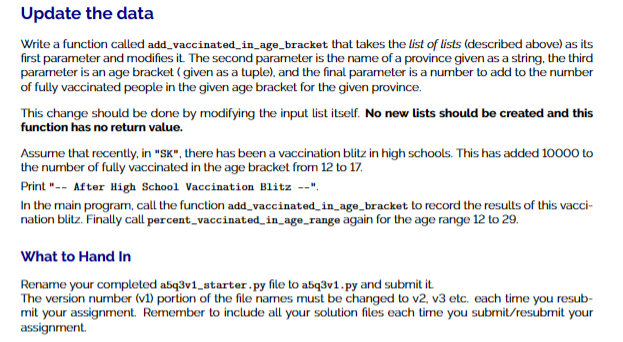

Question 3 (11 points): Purpose: To practice your ability to modify lists and compute with lists of lists Degree of Difficulty: Moderate For this question, you are given some vaccination data, by age bracket, from https://health-infobase.canada.ca covid-19 for some provinces. Starter File a5q3v1_starter.py is a file that contains a list of lists, to which the variable Covid_Data refers, which contains information about vaccination numbers, by age bracket, in some provinces. 1 The first item in Covid_Data is a list whose first item is a string "age bracket" , and whose second item is a list of the names of several provinces. The other items in Covid_Data are lists whose first item is a tuple denoting an age bracket and whose second item is a list of lists. Each of these sublists correspond to data from a province and the first item is the number of people fully vaccinated and the second item is the population of that province in the givien age group. You should work directly on the starter file a5q3v1_starter.py. Keep in mind that your code should work even if we use a different starting list (representing a different set of provinces, though with the same format) to test your program. Determine percentage of people fully vaccinated in an age range for each given province. To do this you will need to write a function called prov_percent_vaccinated_in_age_range, which takes the list of lists described above as the first parameter, and the name of a particular province, given as a string (ie. "BC"), as the second parameter, the lower and upper bounds on an age range are the third and fourth parameters. This function should return the percent fully vaccinated in the given age range in the given province. To do this you may find the list method . index () useful to determine the index of of the data corresponding to a province. Note that L.index("Prov") will be 2 if "Prov" is the 3 th item in list L. For example, in the sample data, the index of "SK" in the list Covid_Data [0] [1] is 2. To limit the number of decimal places returned use the function round0. For example, If x3.567, then round (x,1) returns 3.6. Next create a function percent_vaccinated_in_age_range which takes the list of lists described above as its first parameter, the lower and upper bounds of an age range as its other two parameters. This function first prints out a line indicating the age range, then it should call the function prov_percent_vaccinated_in_age_range and for each province represented in the data prints out a line indicating the percent fully vaccinated in that province. For example: In the age range 30 to 49 in BC 77.4 percent of the people are fully vaccinated in AB 67.8 percent of the people are fully vaccinated In the main program call the function percent_vaccinated_in_age_range twice. first with the age range from 30 to 49 , and second for the age range 12 to 29. 1This data was extracted from the site https//health-infobase.canada.ca/covid-19/vaccination-coverage/\#a on September 24, 2021, and contain data recorded on September 18,2021 Write a function called add_vaccinated_in_age_bracket that takes the list of lists (described above) as its first parameter and modifies it. The second parameter is the name of a province given as a string. the third parameter is an age bracket ( given as a tuple), and the final parameter is a number to add to the number of fully vaccinated people in the given age bracket for the given province. This change should be done by modifying the input list itself. No new lists should be created and this function has no return value. Assume that recently, in "SK", there has been a vaccination blitz in high schools. This has added 10000 to the number of fully vaccinated in the age bracket from 12 to 17. Print "-- After High School Vaccination Blitz --". In the main program, call the function add_vaccinated_in_age_bracket to record the results of this vaccination blitz. Finally call percent_vaccinated_in_age_range again for the age range 12 to 29. What to Hand In Rename your completed a5q3v1_starter.py file to a5q3v1.py and submit it. The version number (v1) portion of the file names must be changed to v2, v3 etc. each time you resubmit your assignment. Remember to include all your solution files each time you submit/resubmit your assignment


