

Answered step by step
Verified Expert Solution
Question
1 Approved Answer
Question 3 17.50 (3 marks) Round off your answer to 1 decimal place. (a) The table below shows the fluctuation of price of prawn from
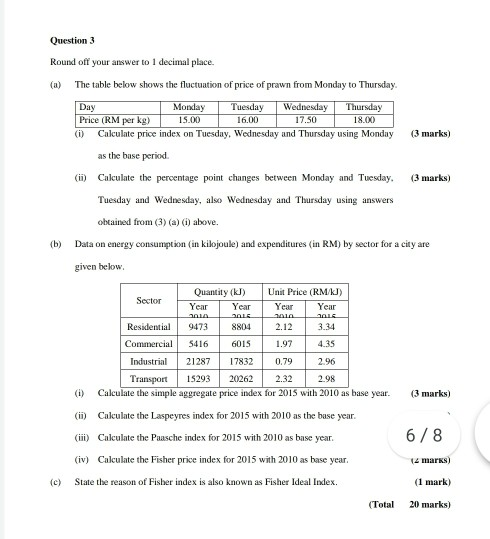
Question 3 17.50 (3 marks) Round off your answer to 1 decimal place. (a) The table below shows the fluctuation of price of prawn from Monday to Thursday. Day Monday Tuesday Wednesday Thursday Price (RM per kg) 15.00 16.00 18.00) (1) Calculate price index on Tuesday, Wednesday and Thursday using Monday as the base period. (i) Calculate the percentage point changes between Monday and Tuesday. Tuesday and Wednesday, also Wednesday and Thursday using answers obtained from (3) (a) (i) above. (3 marks) (b) Data on energy consumption (in kilojoule) and expenditures (in RM) by sector for a city are given below Year Year Quantity (kJ) Unit Price (RM/KJ) Sector Year Year OLE 2016 2016 Residential 9473 8804 2.12 3.34 Commercial 5416 6015 1.97 4.35 Industrial 21287 17832 0.79 2.96 Transport 15293 20262 2.32 2.98 Calculate the simple aggregate price index for 2015 with 2010 as base year. (3 marks) (ii) Calculate the Laspeyres index for 2015 with 2010 as the base year. (i) Calculate the Paasche index for 2015 with 2010 as base year. (iv) Calculate the Fisher price index for 2015 with 2010 as base year. 6/8 14 marks) (c) State the reason of Fisher index is also known as Fisher Ideal Index. (1 mark) (Total 20 marks) Question 3 17.50 (3 marks) Round off your answer to 1 decimal place. (a) The table below shows the fluctuation of price of prawn from Monday to Thursday. Day Monday Tuesday Wednesday Thursday Price (RM per kg) 15.00 16.00 18.00) (1) Calculate price index on Tuesday, Wednesday and Thursday using Monday as the base period. (i) Calculate the percentage point changes between Monday and Tuesday. Tuesday and Wednesday, also Wednesday and Thursday using answers obtained from (3) (a) (i) above. (3 marks) (b) Data on energy consumption (in kilojoule) and expenditures (in RM) by sector for a city are given below Year Year Quantity (kJ) Unit Price (RM/KJ) Sector Year Year OLE 2016 2016 Residential 9473 8804 2.12 3.34 Commercial 5416 6015 1.97 4.35 Industrial 21287 17832 0.79 2.96 Transport 15293 20262 2.32 2.98 Calculate the simple aggregate price index for 2015 with 2010 as base year. (3 marks) (ii) Calculate the Laspeyres index for 2015 with 2010 as the base year. (i) Calculate the Paasche index for 2015 with 2010 as base year. (iv) Calculate the Fisher price index for 2015 with 2010 as base year. 6/8 14 marks) (c) State the reason of Fisher index is also known as Fisher Ideal Index. (1 mark) (Total 20 marks)
Step by Step Solution
There are 3 Steps involved in it
Step: 1

Get Instant Access to Expert-Tailored Solutions
See step-by-step solutions with expert insights and AI powered tools for academic success
Step: 2

Step: 3
Ace Your Homework with AI
Get the answers you need in no time with our AI-driven, step-by-step assistance
Get Started
SAP Audit Black Book
Authors: Bhushan Jairamdas Mamtani
1st Edition
9351194086, 978-9351194088