Answered step by step
Verified Expert Solution
Link Copied!

Question

1 Approved Answer

Question 3 (19 pts) - The figure below is a network graph. Blue nodes are the cities of your antennas . You must check out
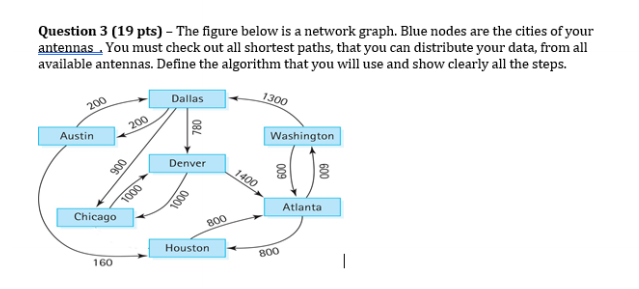
image text in transcribed

Question 3 (19 pts) - The figure below is a network graph. Blue nodes are the cities of your antennas . You must check out all shortest paths, that you can distribute your data, from all available antennas. Define the algorithm that you will use and show clearly all the steps. Dallas 1300 200 Austin 780 200 Washington 006 Denver 1400 600 009 1000 1000 Chicago Atlanta 800 Houston BOO 160 |

Step by Step Solution

There are 3 Steps involved in it

Step: 1

blur-text-image

Get Instant Access to Expert-Tailored Solutions

See step-by-step solutions with expert insights and AI powered tools for academic success

Step: 2

blur-text-image

Step: 3

blur-text-image

Ace Your Homework with AI

Get the answers you need in no time with our AI-driven, step-by-step assistance

Get Started

Recommended Textbook for

Database Systems Design Implementation And Management

Authors: Peter Robb,Carlos Coronel

5th Edition

061906269X, 9780619062699

More Books

Students also viewed these Databases questions