Answered step by step
Verified Expert Solution
Question
1 Approved Answer
Question 3: (20 marks) Part A 1. The graph of the optimal risky portfolio in combination with a risk free asset is called the _line.
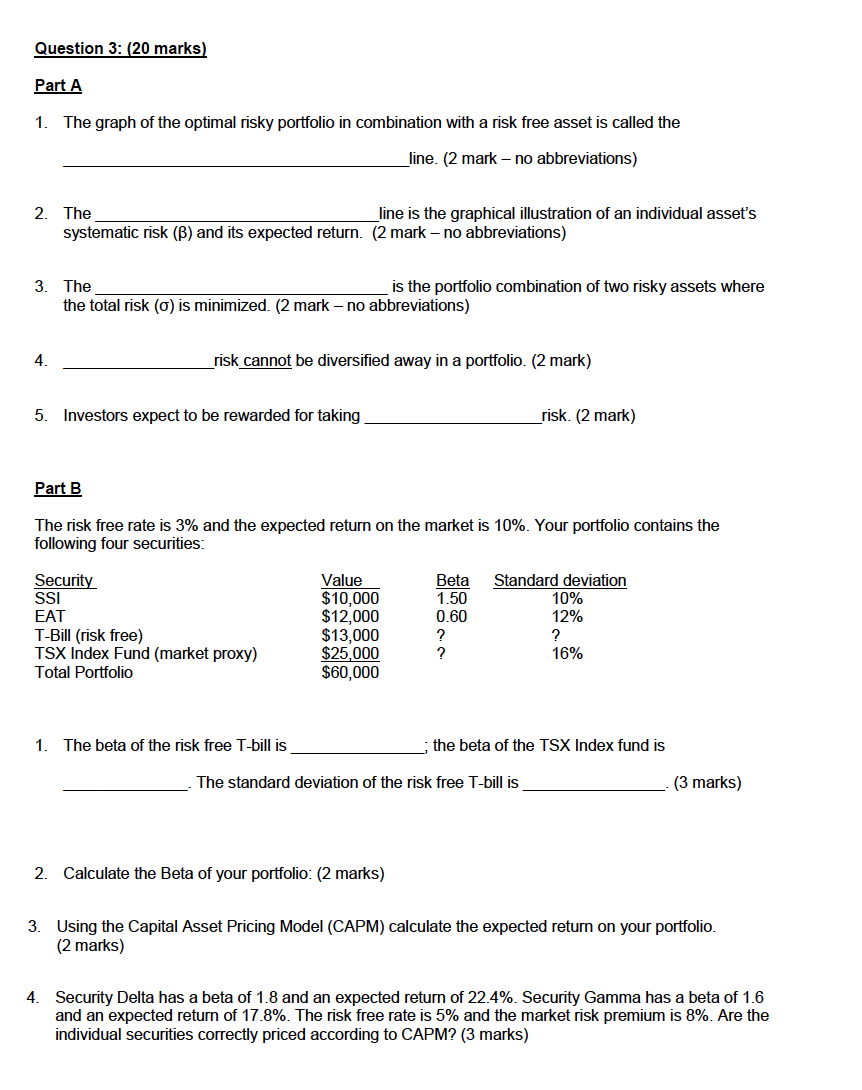
Question 3: (20 marks) Part A 1. The graph of the optimal risky portfolio in combination with a risk free asset is called the _line. (2 mark no abbreviations) 2. The line is the graphical illustration of an individual asset's systematic risk (B) and its expected return. (2 mark - no abbreviations) 3. The is the portfolio combination of two risky assets where the total risk (o) is minimized. (2 mark - no abbreviations) risk cannot be diversified away in a portfolio. (2 mark) 5. Investors expect to be rewarded for taking risk. (2 mark) Part B The risk free rate is 3% and the expected return on the market is 10%. Your portfolio contains the following four securities: Beta 1.50 0.60 Standard deviation 10% 12% Security SSI EAT T-Bill (risk free) TSX Index Fund (market proxy) Total Portfolio Value $10,000 $12,000 $13,000 $25,000 $60,000 16% 1. The beta of the risk free T-bill is ; the beta of the TSX Index fund is _. The standard deviation of the risk free T-bill is - 3 marks) 2. Calculate the Beta of your portfolio: (2 marks) 3. Using the Capital Asset Pricing Model (CAPM) calculate the expected return on your portfolio. (2 marks) 4. Security Delta has a beta of 1.8 and an expected return of 22.4%. Security Gamma has a beta of 1.6 and an expected return of 17.8%. The risk free rate is 5% and the market risk premium is 8%. Are the individual securities correctly priced according to CAPM
Step by Step Solution
There are 3 Steps involved in it
Step: 1
Get Instant Access to Expert-Tailored Solutions
See step-by-step solutions with expert insights and AI powered tools for academic success
Step: 2
Step: 3
Ace Your Homework with AI
Get the answers you need in no time with our AI-driven, step-by-step assistance
Get Started