%Question 3, 4, 5: V = [ ]; for x = 1:1:1000 if frame = 1; V = [n,1]; for n = 1:100 Num =
%Question 3, 4, 5:
V = [ ];
for x = 1:1:1000
if
frame = 1; V = [n,1];
for n = 1:100
Num = round(10*randn(1,1) + 50);
V = [Counting(V), frame]
[Count, Value] = Counting(V);
figure(1);plot(n,x)
axis([0 100 0 50])
plot(n,x,'bo')
drawnow;F(frame)=getframe;
frame=frame+1;
end
v=VideoWriter('Video.avi');
v.FrameRate=30;
open(v); writeVideo(v,F); close(v);
clear;clc;close all;
function [Count, Value] = Counting(V)
Count = zeros (size(V));
Value = zeros (size(V));
for n = 1:2:length(V)
Value(n) = max(V);
Count(n) = sum(V == max(V));
V(max(V) == V) = -Inf;
end
end
 Matlab help this is what I have so far...... how can I modify the code to follow the question and get the code to work. Thanks!
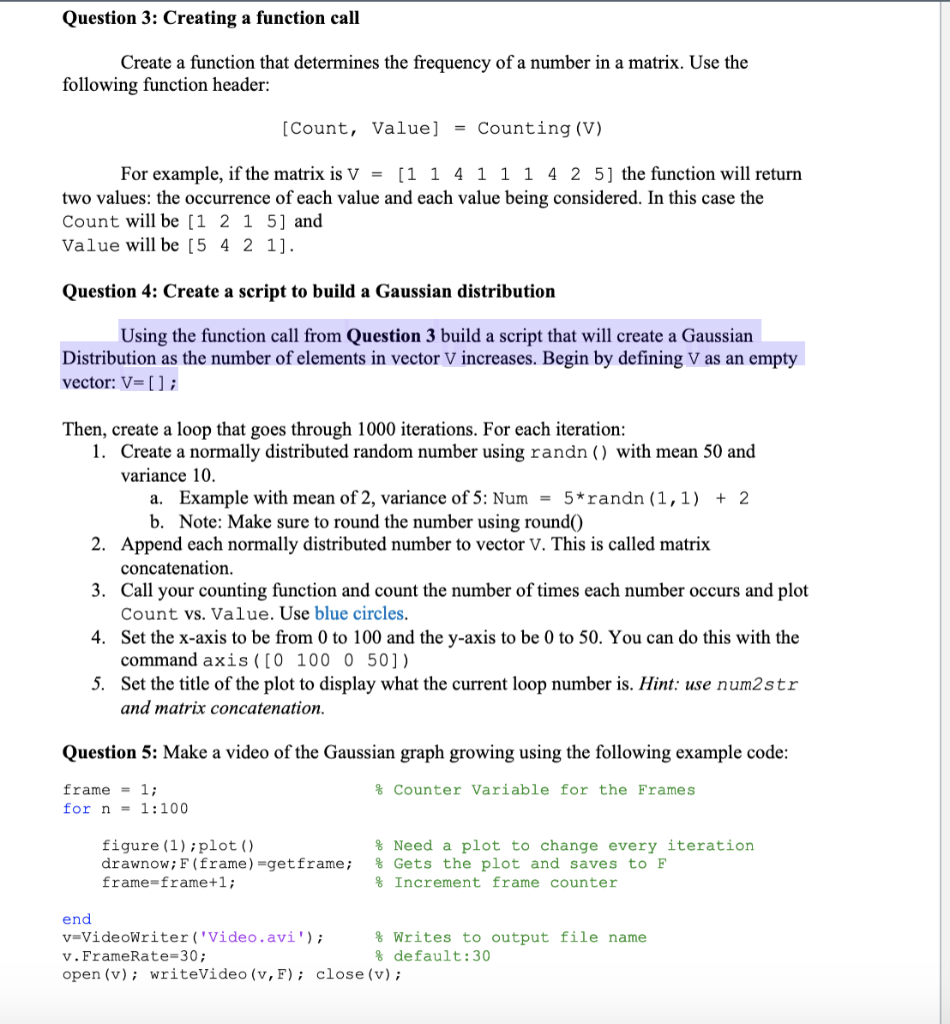
Question 3: Creating a function call Create a function that determines the frequency of a number in a matrix. Use the following function header [Count, Value] Counting (V) For example, if the matrix is V -[1 1 411 1 4 2 5] the function will return two values: the occurrence of each value and each value being considered. In this case the Count will be [1 2 1 5] and Value will be [5 4 2 1. Question 4: Create a script to build a Gaussian distribution Using the function call from Question 3 build a script that will create a Gaussian Distribution as the number of elements in vector V increases. Begin by defining V as an empty vector: V[] Then, create a loop that goes through 1000 iterations. For each iteration 1. Create a normally distributed random number using randn () with mean 50 and variance 10 a. Example with mean of 2, variance of 5: Num = 5 *randn ( 1 , 1 ) + 2 2. 3. 4. 5. b. Note: Make sure to round the number using roundO Append each normally distributed number to vector V. This is called matrix concatenation. Call your counting function and count the number of times each number occurs and plot Count vs. Value. Use blue circles Set the x-axis to be from 0 to 100 and the y-axis to be 0 to 50. You can do this with the command axis ([0 100 0 50]) Set the title of the plot to display what the current loop number is. Hint: use num2str and matrix concatenation Question 5: Make a video of the Gaussian graph growing using the following example code frame1; for n = 1:100 % Counter variable for the Frames figure (1) iplot () drawnow; F (frame-getframe; frame-frame+1; % Need a plot to change every iteration % Gets the plot and saves to F % increment frame counter end v-VideoWriter ('Video.avi) v. FrameRate- 30 open (v) writeVideo (v, F); close (v) % writes to output file name % default:30 Question 3: Creating a function call Create a function that determines the frequency of a number in a matrix. Use the following function header [Count, Value] Counting (V) For example, if the matrix is V -[1 1 411 1 4 2 5] the function will return two values: the occurrence of each value and each value being considered. In this case the Count will be [1 2 1 5] and Value will be [5 4 2 1. Question 4: Create a script to build a Gaussian distribution Using the function call from Question 3 build a script that will create a Gaussian Distribution as the number of elements in vector V increases. Begin by defining V as an empty vector: V[] Then, create a loop that goes through 1000 iterations. For each iteration 1. Create a normally distributed random number using randn () with mean 50 and variance 10 a. Example with mean of 2, variance of 5: Num = 5 *randn ( 1 , 1 ) + 2 2. 3. 4. 5. b. Note: Make sure to round the number using roundO Append each normally distributed number to vector V. This is called matrix concatenation. Call your counting function and count the number of times each number occurs and plot Count vs. Value. Use blue circles Set the x-axis to be from 0 to 100 and the y-axis to be 0 to 50. You can do this with the command axis ([0 100 0 50]) Set the title of the plot to display what the current loop number is. Hint: use num2str and matrix concatenation Question 5: Make a video of the Gaussian graph growing using the following example code frame1; for n = 1:100 % Counter variable for the Frames figure (1) iplot () drawnow; F (frame-getframe; frame-frame+1; % Need a plot to change every iteration % Gets the plot and saves to F % increment frame counter end v-VideoWriter ('Video.avi) v. FrameRate- 30 open (v) writeVideo (v, F); close (v) % writes to output file name % default:30