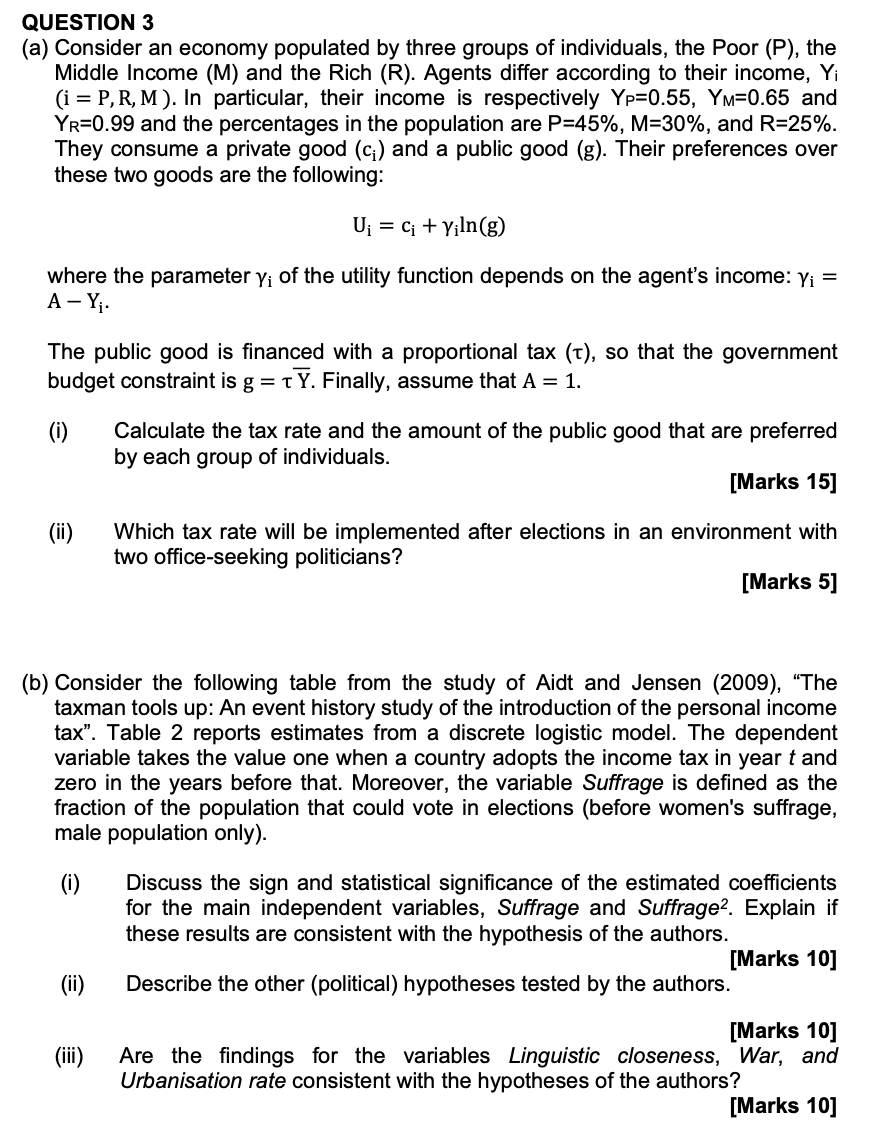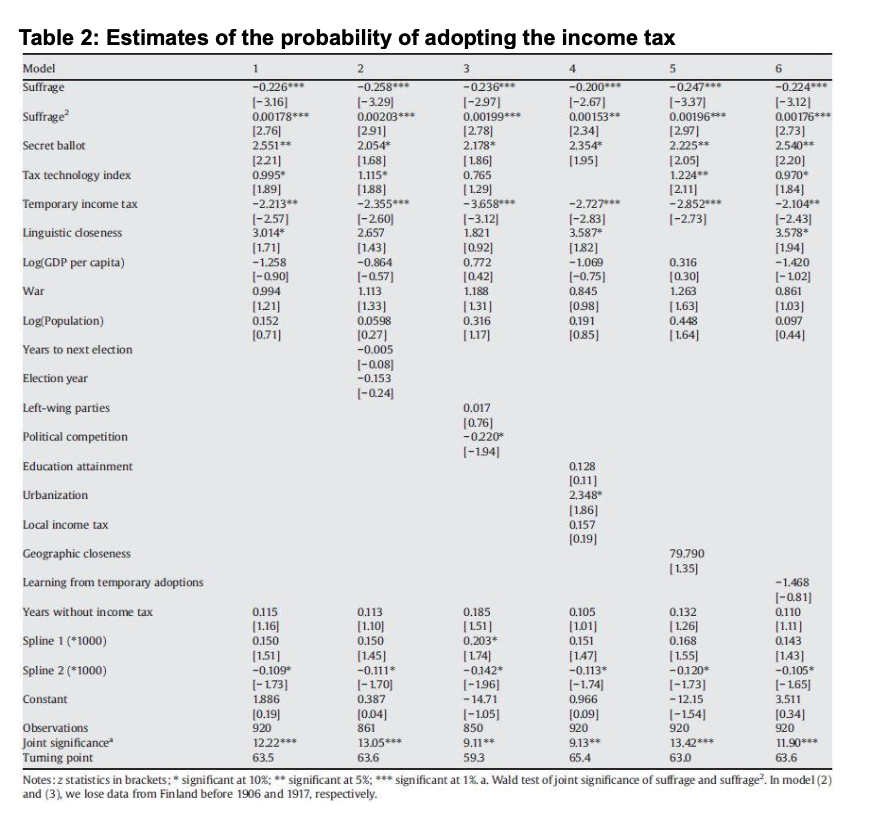

QUESTION 3 (a) Consider an economy populated by three groups of individuals, the Poor (P), the Middle Income (M) and the Rich (R). Agents differ according to their income, Yi (i = P, R, M). In particular, their income is respectively Yp=0.55, YM=0.65 and YR=0.99 and the percentages in the population are P=45%, M=30%, and R=25%. They consume a private good (c) and a public good (g). Their preferences over these two goods are the following: U; = c; + yiln(g) where the parameter Yi of the utility function depends on the agent's income: Yi = A-Y. The public good is financed with a proportional tax (T), so that the government budget constraint is g = TY. Finally, assume that A = 1. (i) Calculate the tax rate and the amount of the public good that are preferred by each group of individuals. [Marks 15] (ii) Which tax rate will be implemented after elections in an environment with two office-seeking politicians? [Marks 5] (b) Consider the following table from the study of Aidt and Jensen (2009), The taxman tools up: An event history study of the introduction of the personal income tax. Table 2 reports estimates from a discrete logistic model. The dependent variable takes the value one when a country adopts the income tax in year t and zero in the years before that. Moreover, the variable Suffrage is defined as the fraction of the population that could vote in elections (before women's suffrage, male population only). (i) Discuss the sign and statistical significance of the estimated coefficients for the main independent variables, Suffrage and Suffrage? Explain if these results are consistent with the hypothesis of the authors. [Marks 10] Describe the other (political) hypotheses tested by the authors. (ii) (iii) [Marks 10] Are the findings for the variables Linguistic closeness, War, and Urbanisation rate consistent with the hypotheses of the authors? [Marks 10] Table 2: Estimates of the probability of adopting the income tax Model 2 3 5 6 Suffrage -0.226*** -0.258*** -0236*** -0.200*** -0.247*** -0.224*** (-3.16) |-3.29) 1-2971 1-2.67] [-337) |-3.12) Suffrage? 0.00178*** 0.00203*** 0.00199*** 0.00153** 0.00196*** 0.00176*** (2.761 [2.911 [2.78) 12.341 [2.97] Secret ballot 12.73) 2.551** 2.054* 2.178* 2.354 2.225** 2.540** [221] [1.68] (1.861 [1.95) [2.05) [220] Tax technology index 0.995 1.115 0.765 1.224** 0.970 [1891 [188) [ 1.29) [2.11) [1.84) Temporary income tax -2.213** -2.355*** -3.658*** -2.727*** -2852*** -2.104** |-2.57] 1-2601 1-3.12) 1-2.83] Linguistic closeness 1-2.731 |-2.431 3.014 2.657 1.821 3.587* 3.578 [1.711 [143] 10.92] [182] Log(GDP per capita) [1.94] -1.258 -0.864 0.772 -1.069 0.316 -1.420 (-0.90 (-0.57] [0.42] (-0.75] [0.30 (-1,02] War 0.994 1.113 1.188 0.845 1.263 0.861 (1.211 (1.33) [1.31) (0.98) [1.631 (1.031 Log(Population) 0.152 0.0598 0.316 0.191 0.448 0.097 10.711 [027] (1.17) 1085) (164) (0.44) Years to next election -0.005 (-0.08) Election year -0.153 |-0.24 Left-wing parties 0.017 10.76) Political competition -0220* 1-1941 Education attainment 0.128 [0.11] Urbanization 2.348 [1.86) Local income tax 0.157 [0.19) Geographic closeness 79.790 Learning from temporary adoptions (1.35) -1.468 (-0.81) Years without income tax 0.115 0.113 0.185 0.105 0.132 0.110 [1.16] [1.10) (1.51) (1.01) [1.261 [1.11) Spline 1 (*1000) 0.150 0.150 0.203 0.151 0.168 0.143 (1.511 [1.45] [1.741 (1.47] (1.55) [143] Spline 2 (*1000) -0.109* -0.111* -0.142* -0.113 -0.120* -0.105 [-1.73) (-1.70 [-196) (-1.74 [-1.73] [-1.65) Constant 1.886 0.387 - 14.71 0.966 - 12.15 3.511 [0.19) 10.04] (-105] (0.09) (-1541 [0.34) Observations 920 861 850 920 920 920 Joint significance 1222*** 13.05*** 9.11** 9.13** 13.42*** 11.90*** Tuming point 63.5 63.6 593 65.4 63.0 63.6 Notes:z statistics in brackets: * significant at 10%; ** significant at 5%: *** significant at 1%. a. Wald test of joint significance of suffrage and suffrage. In model (2) and (3). we lose data from Finland before 1906 and 1917, respectively. QUESTION 3 (a) Consider an economy populated by three groups of individuals, the Poor (P), the Middle Income (M) and the Rich (R). Agents differ according to their income, Yi (i = P, R, M). In particular, their income is respectively Yp=0.55, YM=0.65 and YR=0.99 and the percentages in the population are P=45%, M=30%, and R=25%. They consume a private good (c) and a public good (g). Their preferences over these two goods are the following: U; = c; + yiln(g) where the parameter Yi of the utility function depends on the agent's income: Yi = A-Y. The public good is financed with a proportional tax (T), so that the government budget constraint is g = TY. Finally, assume that A = 1. (i) Calculate the tax rate and the amount of the public good that are preferred by each group of individuals. [Marks 15] (ii) Which tax rate will be implemented after elections in an environment with two office-seeking politicians? [Marks 5] (b) Consider the following table from the study of Aidt and Jensen (2009), The taxman tools up: An event history study of the introduction of the personal income tax. Table 2 reports estimates from a discrete logistic model. The dependent variable takes the value one when a country adopts the income tax in year t and zero in the years before that. Moreover, the variable Suffrage is defined as the fraction of the population that could vote in elections (before women's suffrage, male population only). (i) Discuss the sign and statistical significance of the estimated coefficients for the main independent variables, Suffrage and Suffrage? Explain if these results are consistent with the hypothesis of the authors. [Marks 10] Describe the other (political) hypotheses tested by the authors. (ii) (iii) [Marks 10] Are the findings for the variables Linguistic closeness, War, and Urbanisation rate consistent with the hypotheses of the authors? [Marks 10] Table 2: Estimates of the probability of adopting the income tax Model 2 3 5 6 Suffrage -0.226*** -0.258*** -0236*** -0.200*** -0.247*** -0.224*** (-3.16) |-3.29) 1-2971 1-2.67] [-337) |-3.12) Suffrage? 0.00178*** 0.00203*** 0.00199*** 0.00153** 0.00196*** 0.00176*** (2.761 [2.911 [2.78) 12.341 [2.97] Secret ballot 12.73) 2.551** 2.054* 2.178* 2.354 2.225** 2.540** [221] [1.68] (1.861 [1.95) [2.05) [220] Tax technology index 0.995 1.115 0.765 1.224** 0.970 [1891 [188) [ 1.29) [2.11) [1.84) Temporary income tax -2.213** -2.355*** -3.658*** -2.727*** -2852*** -2.104** |-2.57] 1-2601 1-3.12) 1-2.83] Linguistic closeness 1-2.731 |-2.431 3.014 2.657 1.821 3.587* 3.578 [1.711 [143] 10.92] [182] Log(GDP per capita) [1.94] -1.258 -0.864 0.772 -1.069 0.316 -1.420 (-0.90 (-0.57] [0.42] (-0.75] [0.30 (-1,02] War 0.994 1.113 1.188 0.845 1.263 0.861 (1.211 (1.33) [1.31) (0.98) [1.631 (1.031 Log(Population) 0.152 0.0598 0.316 0.191 0.448 0.097 10.711 [027] (1.17) 1085) (164) (0.44) Years to next election -0.005 (-0.08) Election year -0.153 |-0.24 Left-wing parties 0.017 10.76) Political competition -0220* 1-1941 Education attainment 0.128 [0.11] Urbanization 2.348 [1.86) Local income tax 0.157 [0.19) Geographic closeness 79.790 Learning from temporary adoptions (1.35) -1.468 (-0.81) Years without income tax 0.115 0.113 0.185 0.105 0.132 0.110 [1.16] [1.10) (1.51) (1.01) [1.261 [1.11) Spline 1 (*1000) 0.150 0.150 0.203 0.151 0.168 0.143 (1.511 [1.45] [1.741 (1.47] (1.55) [143] Spline 2 (*1000) -0.109* -0.111* -0.142* -0.113 -0.120* -0.105 [-1.73) (-1.70 [-196) (-1.74 [-1.73] [-1.65) Constant 1.886 0.387 - 14.71 0.966 - 12.15 3.511 [0.19) 10.04] (-105] (0.09) (-1541 [0.34) Observations 920 861 850 920 920 920 Joint significance 1222*** 13.05*** 9.11** 9.13** 13.42*** 11.90*** Tuming point 63.5 63.6 593 65.4 63.0 63.6 Notes:z statistics in brackets: * significant at 10%; ** significant at 5%: *** significant at 1%. a. Wald test of joint significance of suffrage and suffrage. In model (2) and (3). we lose data from Finland before 1906 and 1917, respectively


