Answered step by step
Verified Expert Solution
Link Copied!

Question

1 Approved Answer

Question 3 a. You have four defined vectors X, Y, Z and L. Write Matlab codes to plot the figures below, make your code neat
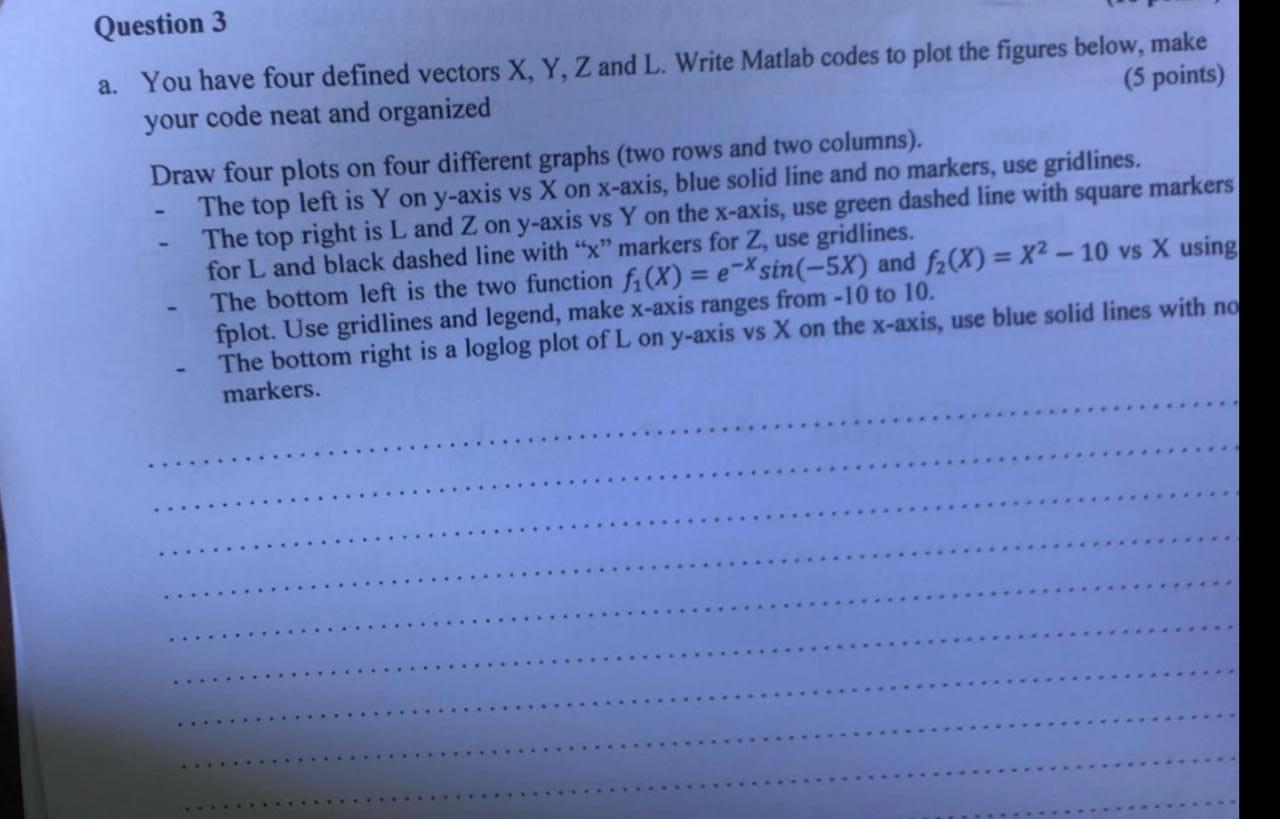
image text in transcribed

Question 3 a. You have four defined vectors X, Y, Z and L. Write Matlab codes to plot the figures below, make your code neat and organized (5 points) Draw four plots on four different graphs (two rows and two columns). The top left is Y on y-axis vs X on x-axis, blue solid line and no markers, use gridlines. The top right is L and Z on y-axis vs Y on the x-axis, use green dashed line with square markers for L and black dashed line with "x" markers for Z, use gridlines. The bottom left is the two function f(x) = e-sin(-5x) and f2(X) = X2 - 10 vs X using fplot. Use gridlines and legend, make x-axis ranges from -10 to 10. The bottom right is a loglog plot of L on y-axis vs X on the x-axis, use blue solid lines with no markers

Step by Step Solution

There are 3 Steps involved in it

Step: 1

blur-text-image

Get Instant Access to Expert-Tailored Solutions

See step-by-step solutions with expert insights and AI powered tools for academic success

Step: 2

blur-text-image

Step: 3

blur-text-image

Ace Your Homework with AI

Get the answers you need in no time with our AI-driven, step-by-step assistance

Get Started

Recommended Textbook for

More Books

Students also viewed these Databases questions

Question

In a closed rigid combustion bomb which properties are held fixed?

Answered: 1 week ago

Question

What is the purpose of a retaining wall, and how is it designed?

Answered: 1 week ago

Question

How do you determine the load-bearing capacity of a soil?

Answered: 1 week ago

Question

what is Edward Lemieux effect / Anomeric effect ?

Answered: 1 week ago

Question

Define Management by exception

Answered: 1 week ago