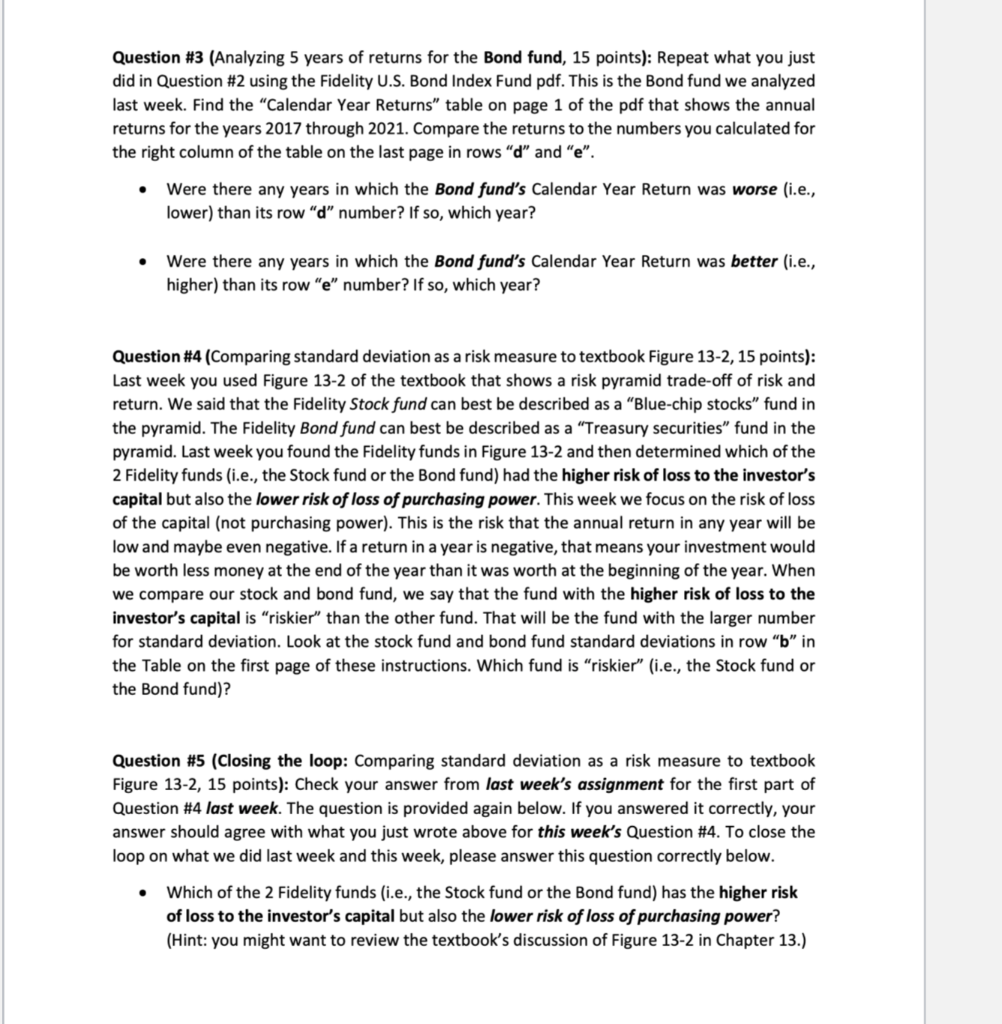
Question #3 (Analyzing 5 years of returns for the Bond fund, 15 points): Repeat what you just did in Question #2 using the Fidelity U.S. Bond Index Fund pdf. This is the Bond fund we analyzed last week. Find the Calendar Year Returns" table on page 1 of the pdf that shows the annual returns for the years 2017 through 2021. Compare the returns to the numbers you calculated for the right column of the table on the last page in rows d and e. Were there any years in which the Bond fund's Calendar Year Return was worse (i.e., lower) than its row "d" number? If so, which year? . Were there any years in which the Bond fund's Calendar Year Return was better (i.e., higher) than its row "e" number? If so, which year? Question #4 (Comparing standard deviation as a risk measure to textbook Figure 13-2, 15 points): Last week you used Figure 13-2 of the textbook that shows a risk pyramid trade-off of risk and return. We said that the Fidelity Stock fund can best be described as a "Blue-chip stocks" fund in the pyramid. The Fidelity Bond fund can best be described as a "Treasury securities fund in the pyramid. Last week you found the Fidelity funds in Figure 13-2 and then determined which of the 2 Fidelity funds (i.e., the Stock fund or the Bond fund) had the higher risk of loss to the investor's capital but also the lower risk of loss of purchasing power. This week we focus on the risk of loss of the capital (not purchasing power). This is the risk that the annual return in any year will be low and maybe even negative. If a return in a year is negative, that means your investment would be worth less money at the end of the year than it was worth at the beginning of the year. When we compare our stock and bond fund, we say that the fund with the higher risk of loss to the investor's capital is "riskier" than the other fund. That will be the fund with the larger number for standard deviation. Look at the stock fund and bond fund standard deviations in row "b" in the Table on the first page of these instructions. Which fund is riskier" (i.e., the Stock fund or the Bond fund)? Question #5 (Closing the loop: Comparing standard deviation as a risk measure to textbook Figure 13-2, 15 points): Check your answer from last week's assignment for the first part of Question #4 last week. The question is provided again below. If you answered it correctly, your answer should agree with what you just wrote above for this week's Question #4. To close the loop on what we did last week and this week, please answer this question correctly below. . Which of the 2 Fidelity funds (i.e., the Stock fund or the Bond fund) has the higher risk of loss to the investor's capital but also the lower risk of loss of purchasing power? (Hint: you might want to review the textbook's discussion of Figure 13-2 in Chapter 13.) Question #3 (Analyzing 5 years of returns for the Bond fund, 15 points): Repeat what you just did in Question #2 using the Fidelity U.S. Bond Index Fund pdf. This is the Bond fund we analyzed last week. Find the Calendar Year Returns" table on page 1 of the pdf that shows the annual returns for the years 2017 through 2021. Compare the returns to the numbers you calculated for the right column of the table on the last page in rows d and e. Were there any years in which the Bond fund's Calendar Year Return was worse (i.e., lower) than its row "d" number? If so, which year? . Were there any years in which the Bond fund's Calendar Year Return was better (i.e., higher) than its row "e" number? If so, which year? Question #4 (Comparing standard deviation as a risk measure to textbook Figure 13-2, 15 points): Last week you used Figure 13-2 of the textbook that shows a risk pyramid trade-off of risk and return. We said that the Fidelity Stock fund can best be described as a "Blue-chip stocks" fund in the pyramid. The Fidelity Bond fund can best be described as a "Treasury securities fund in the pyramid. Last week you found the Fidelity funds in Figure 13-2 and then determined which of the 2 Fidelity funds (i.e., the Stock fund or the Bond fund) had the higher risk of loss to the investor's capital but also the lower risk of loss of purchasing power. This week we focus on the risk of loss of the capital (not purchasing power). This is the risk that the annual return in any year will be low and maybe even negative. If a return in a year is negative, that means your investment would be worth less money at the end of the year than it was worth at the beginning of the year. When we compare our stock and bond fund, we say that the fund with the higher risk of loss to the investor's capital is "riskier" than the other fund. That will be the fund with the larger number for standard deviation. Look at the stock fund and bond fund standard deviations in row "b" in the Table on the first page of these instructions. Which fund is riskier" (i.e., the Stock fund or the Bond fund)? Question #5 (Closing the loop: Comparing standard deviation as a risk measure to textbook Figure 13-2, 15 points): Check your answer from last week's assignment for the first part of Question #4 last week. The question is provided again below. If you answered it correctly, your answer should agree with what you just wrote above for this week's Question #4. To close the loop on what we did last week and this week, please answer this question correctly below. . Which of the 2 Fidelity funds (i.e., the Stock fund or the Bond fund) has the higher risk of loss to the investor's capital but also the lower risk of loss of purchasing power? (Hint: you might want to review the textbook's discussion of Figure 13-2 in Chapter 13.)


