Answered step by step
Verified Expert Solution
Link Copied!

Question

1 Approved Answer

Question 3. Based on your answers from questions 1 and 2, calculate the upper and lower control limits for mean and range charts, and decide

Question 3. Based on your answers from questions 1 and 2, calculate the upper and lower control limits for mean and range charts, and decide if the process is in control (30 points, 5 points each). Upper control limit Lower control limit In control? Upper control limit Lower control limit In control? Mean Chart Range Chart
image text in transcribed
Question 3. Based on your answers from questions 1 and 2, calculate the upper and lower Question 1. The latest Samsung Update has a nominal time of 80 minutes. The results provided are from samples of five observations. Calculate the mean and range for each column ( 40 points, 4 points each). Question 2. Use factors from Table 10.3 in text or provided in the lecture to calculate the following based on the sample and your answers from question 1 ( 30 points, 5 points each)

Step by Step Solution

There are 3 Steps involved in it

Step: 1

blur-text-image

Get Instant Access to Expert-Tailored Solutions

See step-by-step solutions with expert insights and AI powered tools for academic success

Step: 2

blur-text-image

Step: 3

blur-text-image

Ace Your Homework with AI

Get the answers you need in no time with our AI-driven, step-by-step assistance

Get Started

Recommended Textbook for

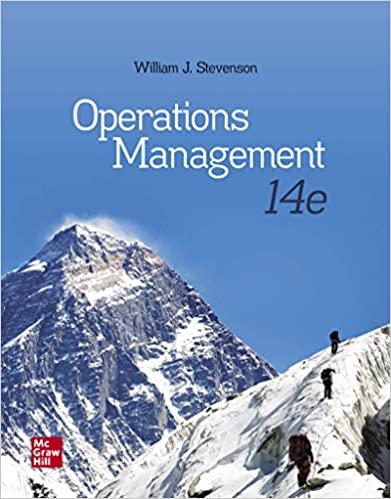
Operations Management

Authors: William J Stevenson

14th Edition

126023889X, 978-1260238891

More Books

Students also viewed these General Management questions

Question

Identify the major functions of public affairs departments.

Answered: 1 week ago

Question

What laws were probably being violated?

Answered: 1 week ago