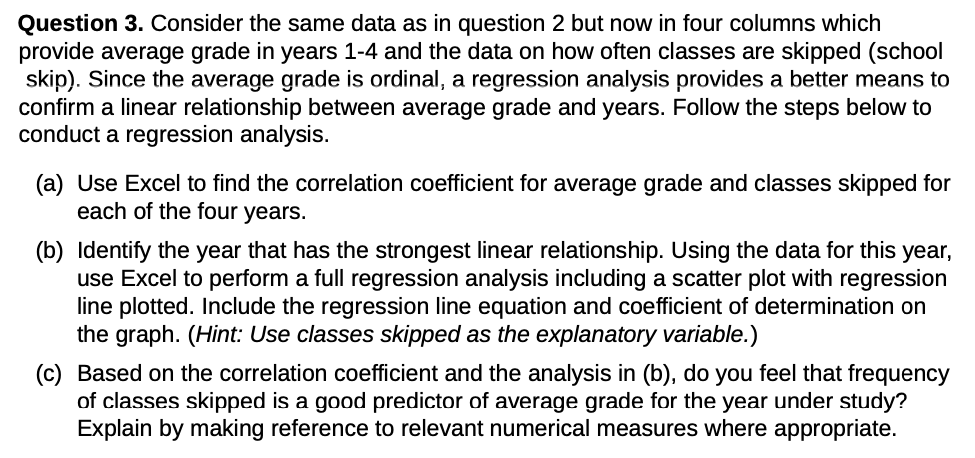
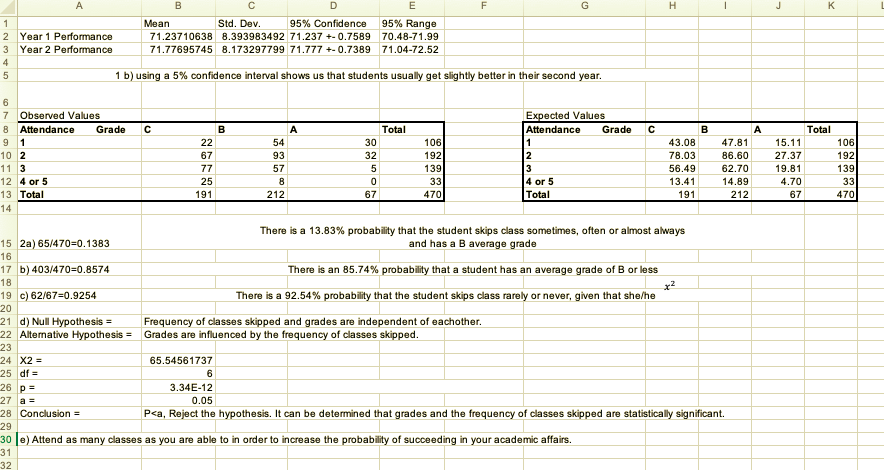
Question 3. Consider the same data as in question 2 but now in four columns which provide average grade in years 1-4 and the data on how often classes are skipped (school skip). Since the average grade is ordinal, a regression analysis provides a better means to confirm a linear relationship between average grade and years. Follow the steps below to conduct a regression analysis. (a) Use Excel to find the correlation coefficient for average grade and classes skipped for each of the four years. (b) Identify the year that has the strongest linear relationship. Using the data for this year, use Excel to perform afull regression analysis including a scatter plot with regression line plotted. Include the regression line equation and coefficient of determination on the graph. (Hint: Use classes skipped as the explanatory variable.) (c) Based on the correlation coefficient and the analysis in (b), do you feel that frequency of classes skipped is a good predictor of average grade for the year under study? Explain by making reference to relevant numerical measures where appropriate. A B C D E F G H K Mean Std. Dev. 95% Confidence 95% Range Year 1 Performance 71.23710638 8.393983492 71.237 +- 0.7589 70.48-71.99 Year 2 Performance 71.77695745 8.173297799 71.777 +- 0.7389 71.04-72.52 1 b) using a 5% confidence interval shows us that students usually get slightly better in their second year. Observed Values Expected Values B Attendance Grade C B A Total Attendance Grade C B A Total 9 22 54 30 106 43.08 47.81 15.11 106 10 2 67 93 32 192 2 78.03 86.60 27.37 192 11 3 77 57 5 139 3 56.49 62.70 19.81 139 12 4 or 5 25 33 4 or 5 13.41 14.89 4.70 33 13 Total 191 212 67 470 Total 191 212 67 470 14 There is a 13.83% probability that the student skips class sometimes, often or almost always 15 2a) 65/470=0.1383 and has a B average grade 16 17 b) 403/470=0.8574 There is an 85.74% probability that a student has an average grade of B or less 19 c) 62/67=0.9254 There is a 92.54% probability that the student skips class rarely or never, given that she/he 20 21 d) Null Hypothesis = Frequency of classes skipped and grades are independent of eachother. 22 Alternative Hypothesis = Grades are influenced by the frequency of classes skipped. 23 24 X2 = 65.54561737 25 df = 6 26 p = 3.34E-12 27 0.05 28 Conclusion = Pca, Reject the hypothesis. It can be determined that grades and the frequency of classes skipped are statistically significant. 29 30 e) Attend as many classes as you are able to in order to increase the probability of succeeding in your academic affairs. 31


