Answered step by step
Verified Expert Solution
Link Copied!

Question

1 Approved Answer

Question 3. Control Charts for Variables Suppose that a single sampling plan with n = 150 and c = 2 is being used for receiving
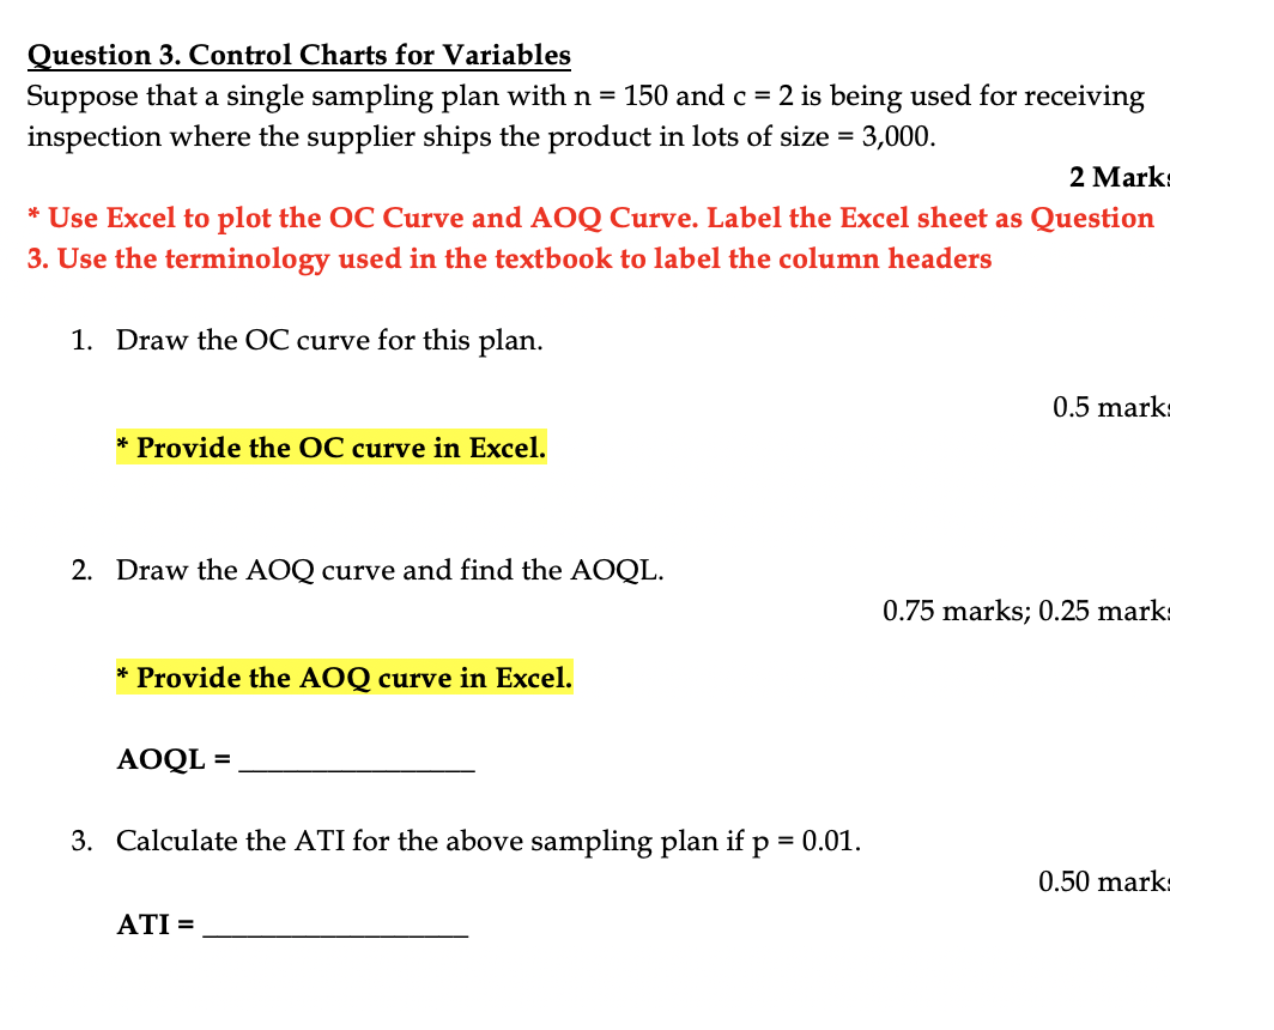
image text in transcribed
Question 3. Control Charts for Variables Suppose that a single sampling plan with n = 150 and c = 2 is being used for receiving inspection where the supplier ships the product in lots of size = 3,000. 2 Mark: * Use Excel to plot the 0C Curve and AOQ Curve. Label the Excel sheet as Question 3. Use the terminology used in the textbook to label the column headers 1. Draw the 0C curve for this plan. 0.5 mark: " Provide the 0C curve in Excel. 2. Draw the AOQ curve and find the AOQL. 0.75 marks; 0.25 mark: " Provide the AOQ curve in Excel. AOQL= 3. Calculate the ATI for the above sampling plan if p = 0.01. 0.50 mark: ATI =

Step by Step Solution

There are 3 Steps involved in it

Step: 1

blur-text-image

Get Instant Access to Expert-Tailored Solutions

See step-by-step solutions with expert insights and AI powered tools for academic success

Step: 2

blur-text-image_2

Step: 3

blur-text-image_3

Ace Your Homework with AI

Get the answers you need in no time with our AI-driven, step-by-step assistance

Get Started

Recommended Textbook for

Linear Algebra and Its Applications

Authors: Gilbert Strang

4th edition

30105678, 30105676, 978-0030105678

More Books

Students also viewed these Mathematics questions