

Answered step by step
Verified Expert Solution
Question
1 Approved Answer
Question 3 Create a graphic of mean weight of the child versus year, which includes separate lines for the two top race categories, white and
Question
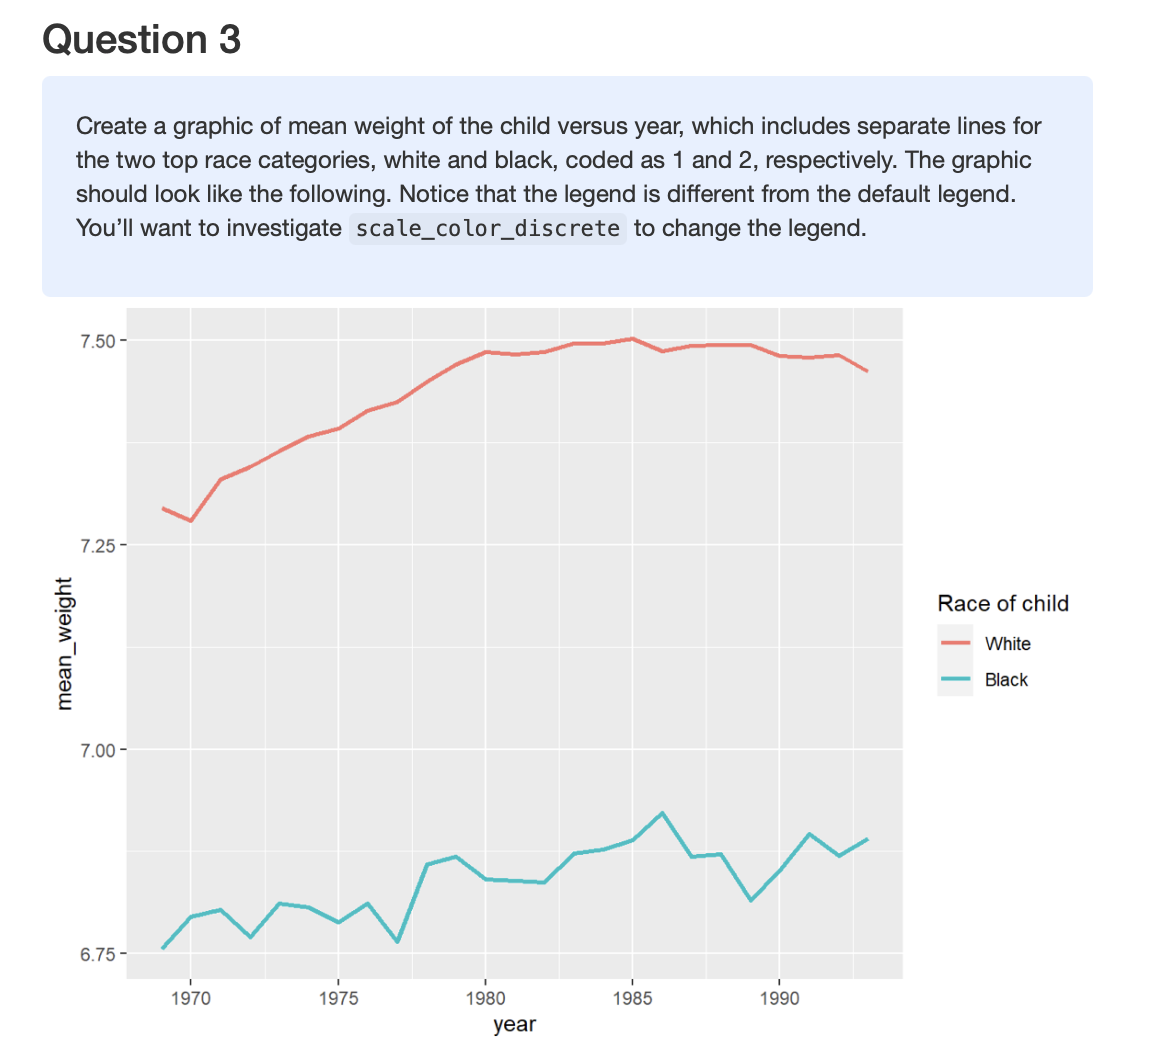
Create a graphic of mean weight of the child versus year, which includes separate lines for the two top race categories, white and black, coded as and respectively. The graphic should look like the following. Notice that the legend is different from the default legend. You'll want to investigate scalecolordiscrete This section will use the BirthDataWithRegionColorscsv data set. This contains data about births in the United States, collected by the Centers for Disease Control CDC The variables in the dataset a is subset of the variables in the full data set, and the observations represent a "small" sample chosen at random of slightly over one million record
Variable Description
year the year of the birth
month the month of the birth
state the state where the birth occurred, including DC for Washington DC
ismale which is TRUE if the child is male, FALSE otherwise
weightpounds the child's birth weight in pounds
motherage the age of the mother
childrace race of the child.
plurality the number of children born as a result of the pregnancy, with representing a single birth, representing twins, etc.
Combine dplyrwith ggplot to create graphical displays of the data. Use filtergroupby and summarize to build the required data frame.
WHAT TO FIND:
Create a graphic of mean weight of the child versus year, which includes separate lines for the two top race categories, white and black, coded as and respectively.
year month state ismale weightpounds motherage childrace plurality region statecolor
CA TRUE NA West blue
CA FALSE NA West blue
CA TRUE NA West blue
CA FALSE NA West blue
CA TRUE NA West blue
CA TRUE NA West blue
CA FALSE NA West blue
CA FALSE NA West blue
CA FALSE NA West blue
CA FALSE NA West blue
CA FALSE NA West blue
CT FALSE NA Northeast blue
CT TRUE NA Northeast blue
CT TRUE NA Northeast blue
CT TRUE NA Northeast blue
CT TRUE NA Northeast blue
DC FALSE NA South blue
DC FALSE NA South blue
DC FALSE NA South blue
DC FALSE NA South blue
IL TRUE NA Midwest blue
IL FALSE NA Midwest blue
IL TRUE NA Midwest blue
IL FALSE NA Midwest blue
IL FALSE NA Midwest blue
IL TRUE NA Midwest blue
IL FALSE NA Midwest blue
IL FALSE NA Midwest blue
MD FALSE NA South blue
MD FALSE NA South blue
MA TRUE NA Northeast blue
Step by Step Solution
There are 3 Steps involved in it
Step: 1

Get Instant Access to Expert-Tailored Solutions
See step-by-step solutions with expert insights and AI powered tools for academic success
Step: 2

Step: 3
Ace Your Homework with AI
Get the answers you need in no time with our AI-driven, step-by-step assistance
Get Started
Objects And Databases International Symposium Sophia Antipolis France June 13 2000 Revised Papers Lncs 1944
Authors: Klaus R. Dittrich ,Giovanna Guerrini ,Isabella Merlo ,Marta Oliva ,M. Elena Rodriguez
2001st Edition
3540416641, 978-3540416647