Answered step by step
Verified Expert Solution
Question
1 Approved Answer
Question 3: Data on the total tobacco exposure time (in seconds) for G-rated animated films with tobacco use released between 1937 and 1997 produced

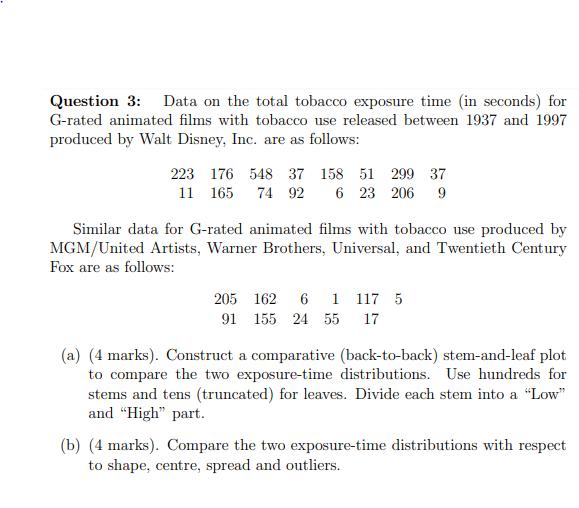
Question 3: Data on the total tobacco exposure time (in seconds) for G-rated animated films with tobacco use released between 1937 and 1997 produced by Walt Disney, Inc. are as follows: 223 176 548 37 158 51 299 37 11 165 74 92 6 23 206 9 Similar data for G-rated animated films with tobacco use produced by MGM/United Artists, Warner Brothers, Universal, and Twentieth Century Fox are as follows: 205 162 6 1 117 5 91 155 24 55 17 (a) (4 marks). Construct a comparative (back-to-back) stem-and-leaf plot to compare the two exposure-time distributions. Use hundreds for stems and tens (truncated) for leaves. Divide each stem into a "Low" and "High" part. (b) (4 marks). Compare the two exposure-time distributions with respect to shape, centre, spread and outliers.
Step by Step Solution
★★★★★
3.25 Rating (151 Votes )
There are 3 Steps involved in it
Step: 1

Get Instant Access to Expert-Tailored Solutions
See step-by-step solutions with expert insights and AI powered tools for academic success
Step: 2

Step: 3

Document Format ( 2 attachments)
636047ea8382b_233871.pdf
180 KBs PDF File
636047ea8382b_233871.docx
120 KBs Word File
Ace Your Homework with AI
Get the answers you need in no time with our AI-driven, step-by-step assistance
Get Started


