Answered step by step
Verified Expert Solution
Question
1 Approved Answer
The following is the cost schedule for a business fim that you derived in your previous problem set (fixed costs are still $30, which


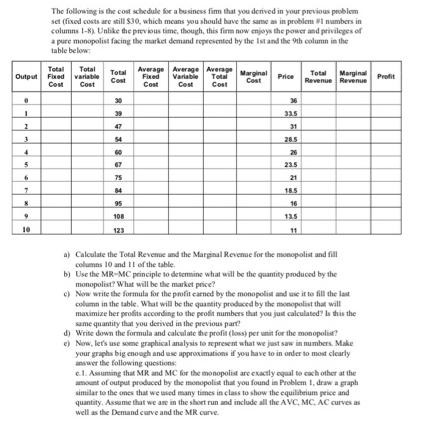
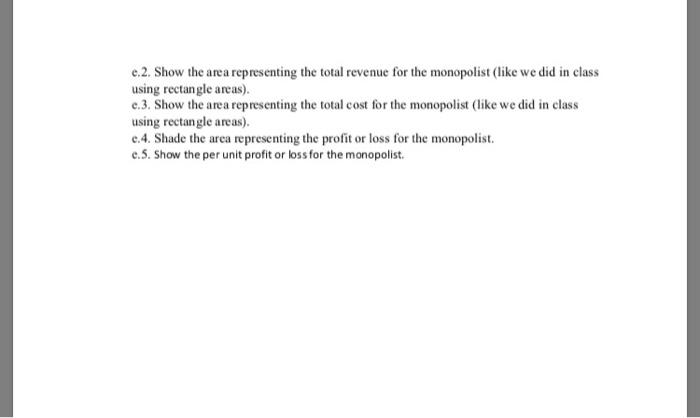
The following is the cost schedule for a business fim that you derived in your previous problem set (fixed costs are still $30, which means you should have the same as in problem i numbers in columns 1-8). Unlike the previous time, though, this firm now enjoys the power and privileges of a pure monopolist facing the market demand represented by the Istand the 9th column in the table below: Total Output Fixed Cost Total variable Total AverageAverage Average Variable Fixed Cost Marginal Cost Total Marginal Revenue Revenue Total Price Profit Cost Cost Cost Cost 30 36 39 335 47 31 54 28.5 26 67 235 75 21 84 18.5 95 16 108 115 10 123 11 a) Calculate the Total Revemue und the Marginal Revenue for the monopolist und fill columns 10 and 11 of the table. b) Use the MR-MC principle to detemine what will be the quantity produced by the monopolist? What will be the market price? e) Now write the formula for the profit carned by the monopolist and use it to fill the last column in the table. What will be the quantity produced by the monopolist that will maximize her profits according to the profit numbers that you just calculated? la this the same quantity that you derived in the previous part d) Write down the formula and calculate the profit (loss) per unit for the monopoliat? e) Now, let's use some graphical analysis to represent what we just saw in mumbers. Make your graphs big enough and use approximations if you have to in order to most clearly answer the following questions: e.1. Assumting that MR and MC for the monopolist are exactly oqual to cach other at the mount of output produced by the monopolist that you found in Problem 1, draw a graph similar to the ones that we used many times in class to show the equilibrium peice and quantity. Assame that we are in the short run and include all the AVC, MC. AC curves as well as the Demand curve and the MR curve. c.2. Show the area representing the total revenue for the monopolist (like we did in class using rectangle areas). c.3. Show the area representing the total cost for the monopolist (like we did in class using rectan gle areas). c.4. Shade the area representing the profit or loss for the monopolist. c.5. Show the per unit profit or loss for the monopolist.
Step by Step Solution
★★★★★
3.42 Rating (149 Votes )
There are 3 Steps involved in it
Step: 1

Get Instant Access to Expert-Tailored Solutions
See step-by-step solutions with expert insights and AI powered tools for academic success
Step: 2

Step: 3

Ace Your Homework with AI
Get the answers you need in no time with our AI-driven, step-by-step assistance
Get Started


