Question
Question 3 It is important for the auditor to understand the areas of risks faced by the client. Perform a risk analysis for Japan Foods.
Question 3 It is important for the auditor to understand the areas of risks faced by the client. Perform a risk analysis for Japan Foods. Refer to the audited financial statements for the most recent financial year.
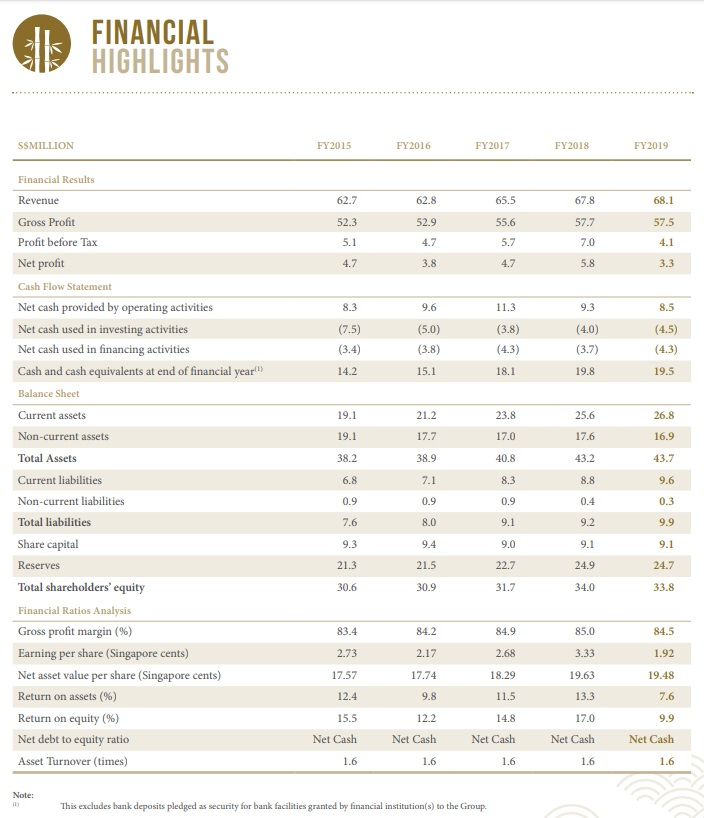
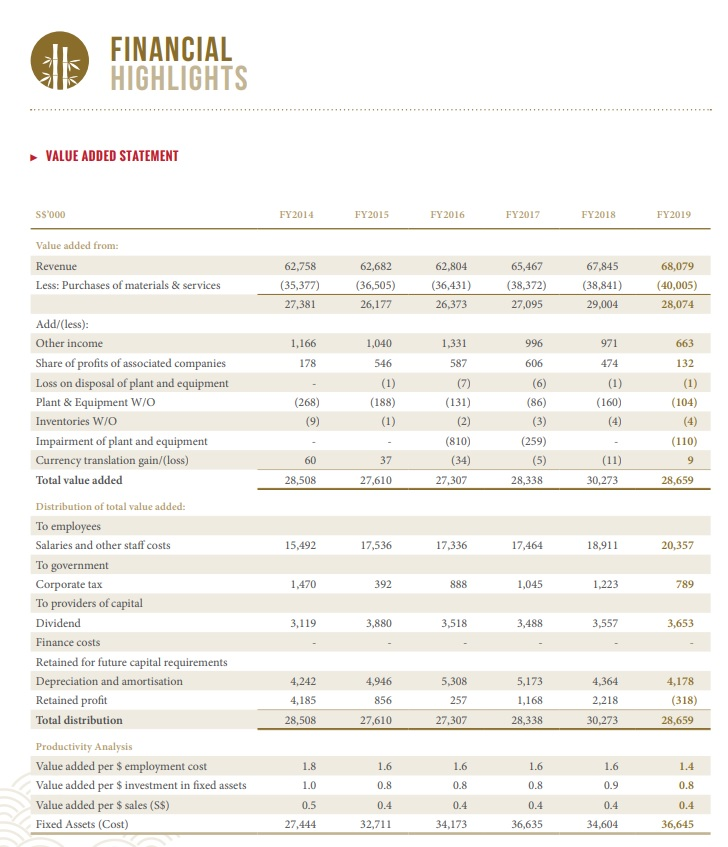
(c) Analyse Japan Foods' financial performance by calculating key financial ratios based on Japan Foods' relevant financial statements. Using these ratios, perform analytical procedures for the audit of Japan Foods' financial statements for the year ended 31 March 2019. (14 marks)
FINANCIAL E HIGHLIGHTS SSMILLION FY2015 FY2016 FY2017 FY2018 FY2019 Financial Results Revenue 62.7 67.8 57.7 Gross Profit 52.3 62.8 52.9 4.7 3.8 65.5 55.6 5.7 4.7 68.1 57.5 4.1 3.3 Profit before Tax 7.0 Net profit 4.7 5.8 Cash Flow Statement 8.5 Net cash provided by operating activities Net cash used in investing activities Net cash used in financing activities Cash and cash equivalents at end of financial year Balance Sheet (7.5) (3.4) 14.2 (5.0) (3.8) 15.1 11.3 (3.8) (4.3) (4.0) (3.7) 19.8 (4.5) (4.3) 19.5 18.1 Current assets 26.8 19.1 19.1 21.2 17.7 23.8 17.0 25.6 17.6 Non-current assets 16.9 Total Assets 38.9 40.8 43.7 Current liabilities 9.6 0.3 Non-current liabilities 0.9 0.9 0.4 Total liabilities 8.0 9.1 9.3 21.3 30.6 9.4 21.5 30.9 22.7 31.7 24.9 34.0 24.7 33.8 83.4 84.2 84.9 84.5 Share capital Reserves Total shareholders' equity Financial Ratios Analysis Gross profit margin (%) Earning per share (Singapore cents) Net asset value per share (Singapore cents) Return on assets (%) Return on equity (%) Net debt to equity ratio Asset Turnover (times) 2.73 1.92 17.57 19.48 12.4 2.17 17.74 9.8 12.2 Net Cash 1.6 2.68 18.29 11.5 14.8 Net Cash 1.6 85.0 3.33 19.63 13.3 17.0 Net Cash 1.6 15.5 Net Cash 1 1.6 7.6 9.9 Net Cash 1.6 Note: This excludes bank deposits pledged as security for bank facilities granted by financial institution(s) to the Group FINANCIAL HIGHLIGHTS VALUE ADDED STATEMENT SS'000 FY 2014 FY2015 FY 2016 FY2017 FY2018 FY2019 Value added from: Revenue Less: Purchases of materials & services 62,758 (35,377) 27,381 62,682 (36,505) 26,177 62,804 (36,431) 26,373 65,467 (38,372) 27,095 67,845 (38,841) 29,004 68,079 (40,005) 28,074 1,040 1,166 178 1,331 587 996 606 971 474 Add/(less): Other income Share of profits of associated companies Loss on disposal of plant and equipment Plant & Equipment W/O Inventories W/O Impairment of plant and equipment Currency translation gain/(loss) Total value added 546 (1) (188) (1) 663 132 (1) (104) (160) (268) (9) (131) (2) (810) (34) 27,307 (86) (3) (259) (5) 8,338 (110) 60 28,508 37 27,610 (11) 30,273 2 28,659 15,492 17,536 17,336 17,464 18,911 20,357 Distribution of total value added: To employees Salaries and other staff costs To government Corporate tax To providers of capital 1,470 392 888 1,045 1,223 789 Dividend 3,119 119 3,880 3,518 3,488 3,557 3,653 Finance costs Retained for future capital requirements Depreciation and amortisation Retained profit Total distribution 5,308 4,242 4,185 28,508 4,946 856 27,610 257 5,173 1,168 28,338 4,364 2,218 30,273 4,178 (318) 28,659 27,307 1.8 Productivity Analysis Value added per $ employment cost Value added per $ investment in fixed assets Value added per $ sales (S$) Fixed Assets (Cost) 1.6 0.8 1.4 0.8 10 1.0 1.6 0.8 0.4 34,173 1.6 0.8 0.4 36,635 1.6 0.9 0.4 0.4 0.5 27,444 0.4 36,645 32,711 34,604Step by Step Solution
There are 3 Steps involved in it
Step: 1

Get Instant Access to Expert-Tailored Solutions
See step-by-step solutions with expert insights and AI powered tools for academic success
Step: 2

Step: 3

Ace Your Homework with AI
Get the answers you need in no time with our AI-driven, step-by-step assistance
Get Started


