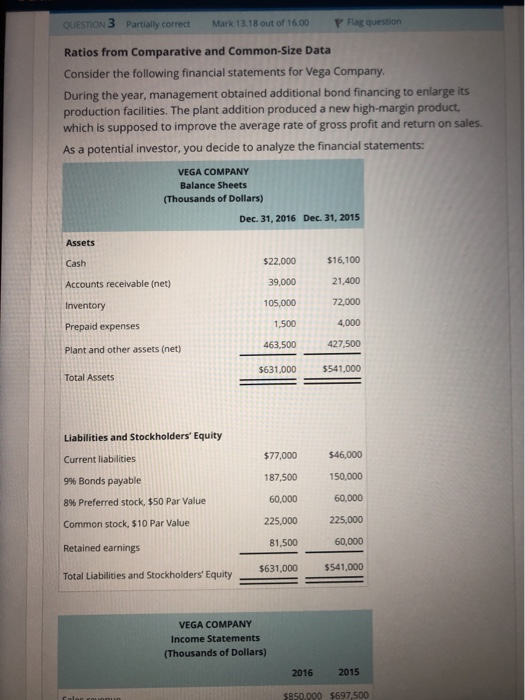
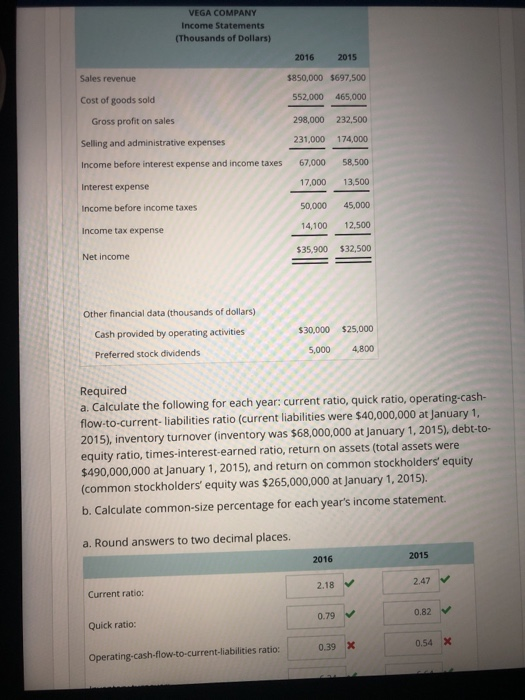
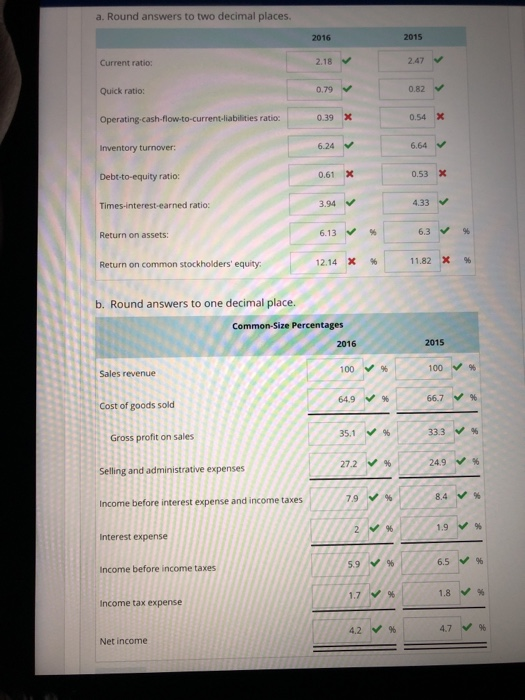
QUESTION 3 Partially correct Mark 13.18 out of 16.00 P Flag question Ratios from Comparative and Common-Size Data Consider the following financial statements for Vega Company. During the year, management obtained additional bond financing to enlarge its production facilities. The plant addition produced a new high-margin product which is supposed to improve the average rate of gross profit and return on sales. As a potential investor, you decide to analyze the financial statements: VEGA COMPANY Balance Sheets (Thousands of Dollars) Dec. 31, 2016 Dec. 31, 2015 Assets Cash Accounts receivable (net) Inventory Prepaid expenses Plant and other assets (net) Total Assets 22.000 $16,100 21,400 72,000 4,000 427,500 $631,000 $541,000 39,000 105,000 1,500 463.500 Liabilities and Stockholders' Equity Current liabilities 996 Bonds payable 896 Preferred stock, $50 Par Value Common stock, $10 Par Value Retained earnings Total Liabilities and Stockholders' Equity $77,000 $46,000 187,500 150,000 60,000 225,000 225,000 60,000 $631,000 $541,000 60,000 81,500 VEGA COMPANY Income Statements (Thousands of Dollars) 2016 2015 $850.000 $697,500 a. Round answers to two decimal places 2016 2015 Current ratio: 2.18 0.79 ) 0.39X 2.47 Quick ratio 0.82 Operating-cash-flow-to-current-liabilities ratio Inventory turnover: Debt-to-equity ratio 0.54 X 6.24 6.64 0.53X Times-interest-earned ratio: 3.94 4.33 Return on assets: 6.13 % 6.3 % Return on common stockholders' equity 12.14 X % | 11.82 X % b. Round answers to one decimal place. Common-Size Percentages 2016 2015 Sales revenue 100 % 100 % Cost of goods sold 64.9 % 66.7 % Gross profit on sales Selling and administrative expenses Income before interest expense and income taxes 333-/% 27.2 % | 24.9 -/%! 7.9 % 8.4 % 96 Interest expense Income before income taxes 6.5 % Income tax expense 42 % 4.7 % Net income