

Answered step by step
Verified Expert Solution
Question
1 Approved Answer
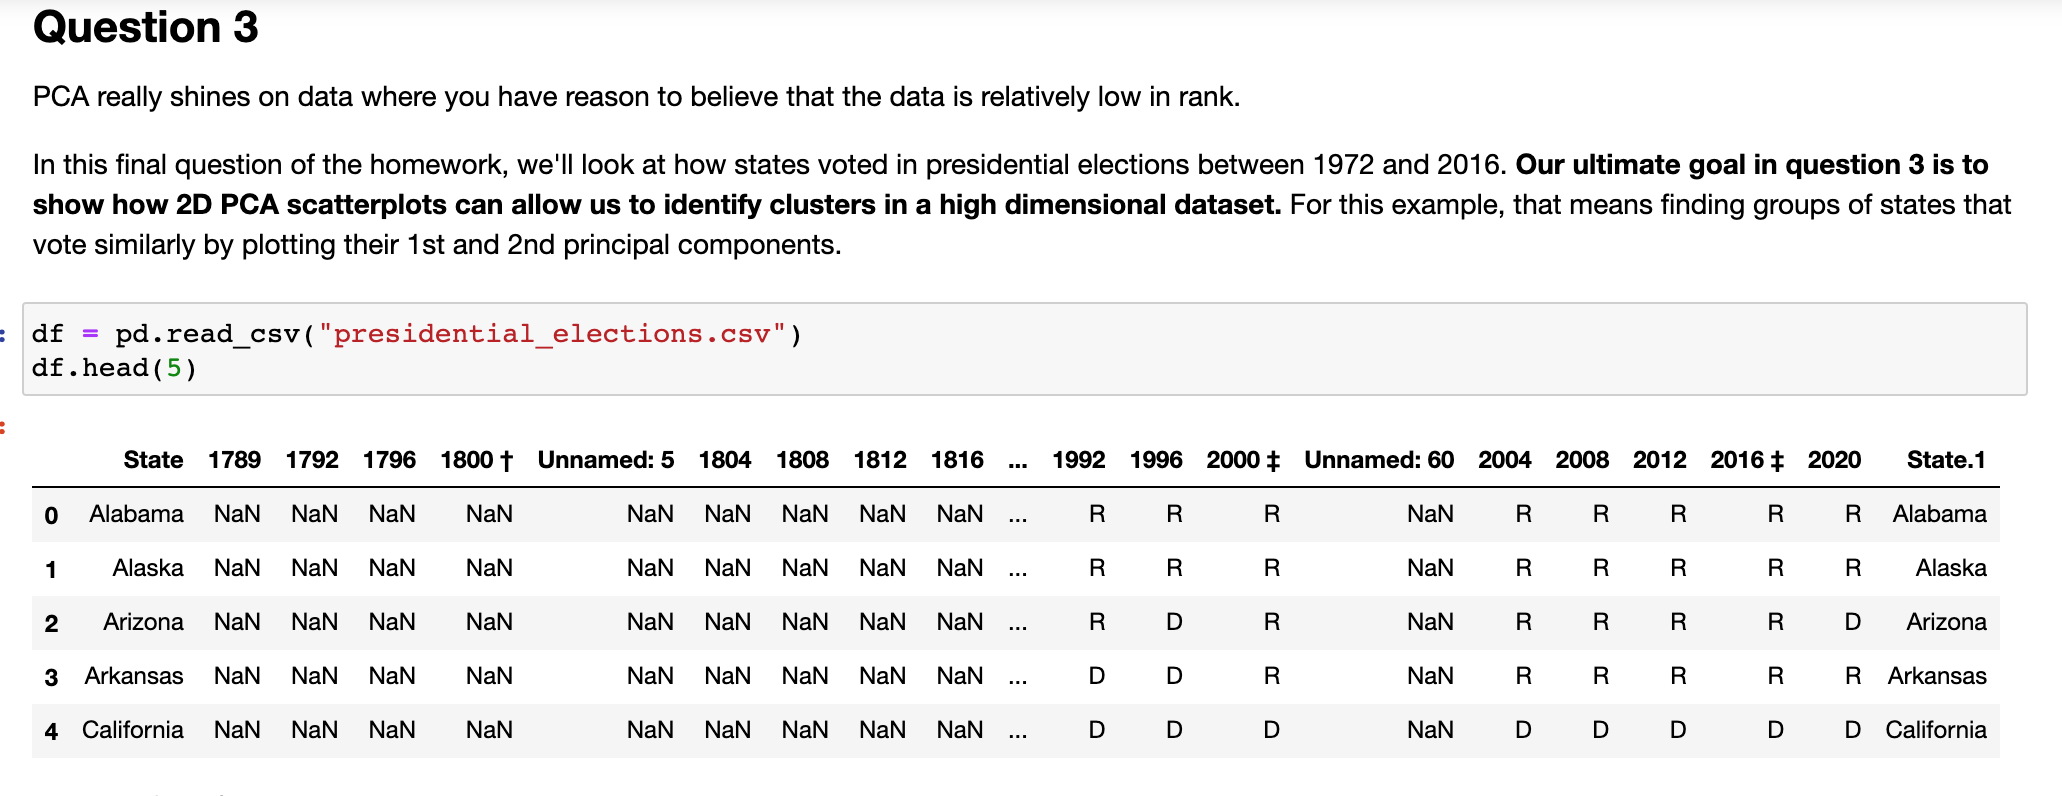
Question 3 PCA really shines on data where you have reason to believe that the data is relatively low in rank. In this final question

Step by Step Solution
There are 3 Steps involved in it
Step: 1

Get Instant Access to Expert-Tailored Solutions
See step-by-step solutions with expert insights and AI powered tools for academic success
Step: 2

Step: 3
Ace Your Homework with AI
Get the answers you need in no time with our AI-driven, step-by-step assistance
Get Started
How To Prove It A Structured Approach
Authors: Daniel J Velleman
2nd Edition
0511159439, 9780511159435