Answered step by step
Verified Expert Solution
Link Copied!

Question

1 Approved Answer

Question 3 relates to the following table of male suicide in the Sydney metropolitan area, stratified by quintile of socio-economic status (SES). (Only the lowest
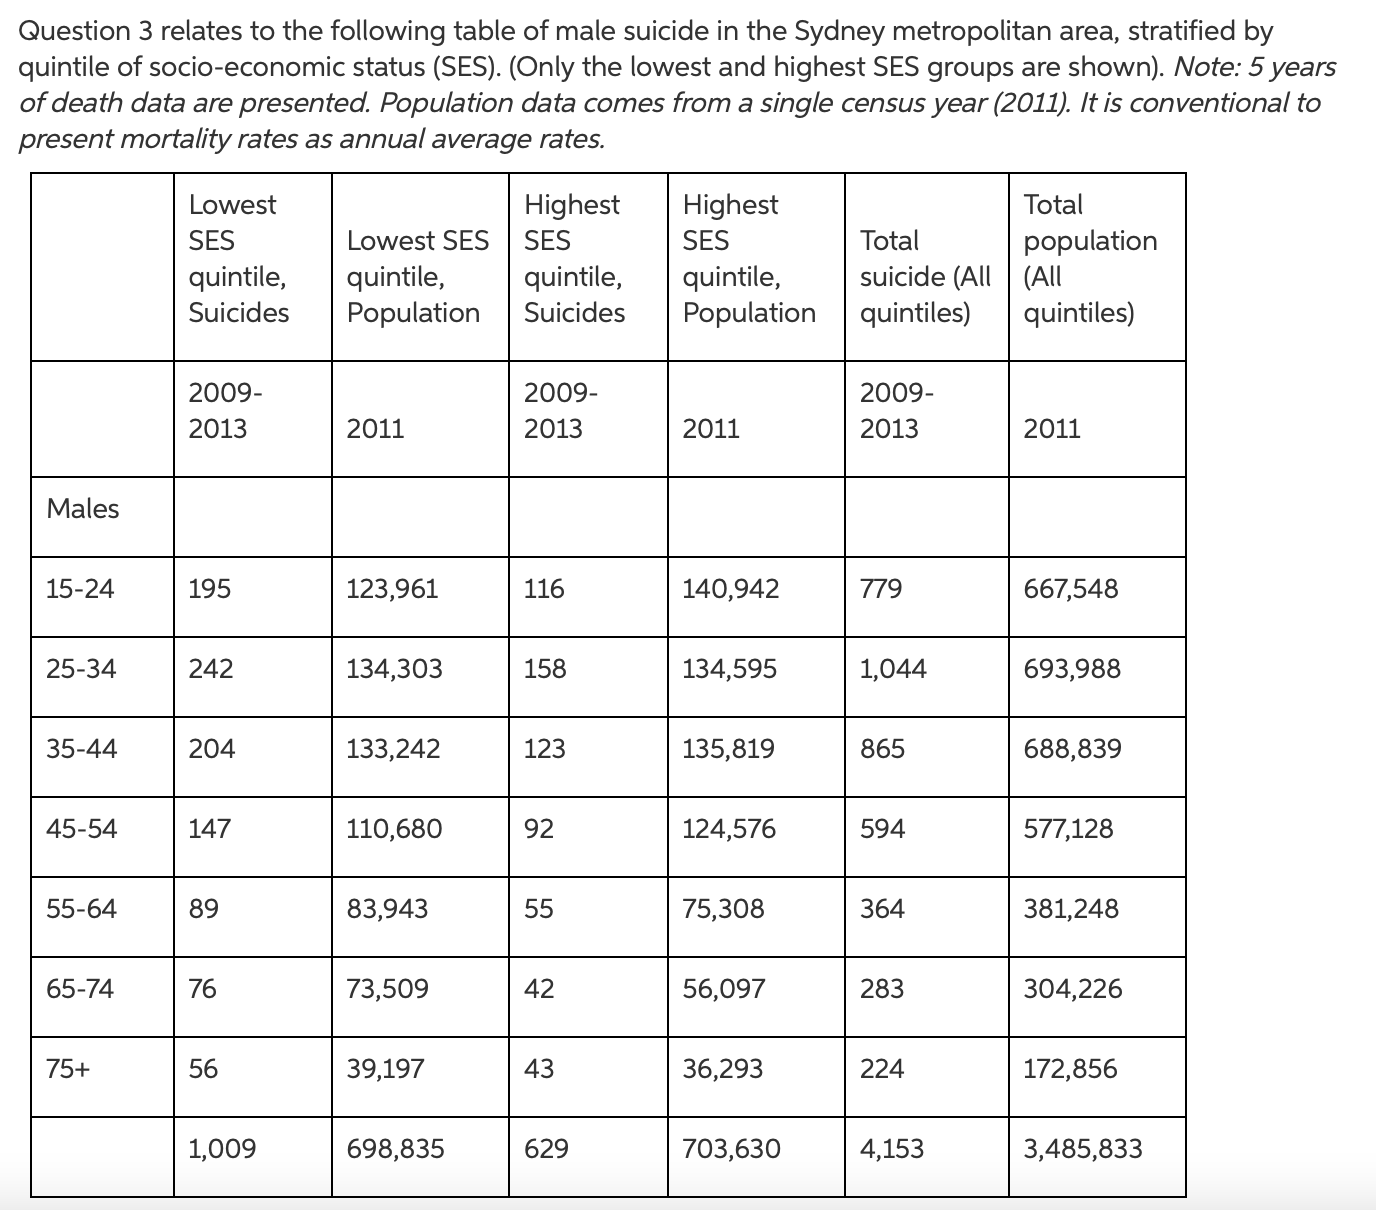
image text in transcribed
Question 3 relates to the following table of male suicide in the Sydney metropolitan area, stratified by quintile of socio-economic status (SES). (Only the lowest and highest SES groups are shown). Note: 5 years of death data are presented. Population data comes from a single census year (2011). It is conventional to present mortality rates as annual average rates. Lowest Highest Highest Total SES Lowest SES SES SES Total population quintile, quintile, quintile, quintile, suicide (All (All Suicides Population Suicides Population quintiles) quintiles) 2009- 2009- 2009- 2013 2011 2013 2011 2013 2011 Males 15-24 195 123,961 116 140,942 779 667,548 25-34 242 134,303 158 134,595 1,044 693,988 35-44 204 133,242 123 135,819 865 688,839 45-54 147 110,680 92 124,576 594 577,128 55-64 89 83,943 55 75,308 364 381,248 65-74 76 73,509 42 56,097 283 304,226 75+ 56 39,197 43 36,293 224 172,856 1,009 698,835 629 703,630 4,153 3,485,833

Step by Step Solution

There are 3 Steps involved in it

Step: 1

blur-text-image

Get Instant Access to Expert-Tailored Solutions

See step-by-step solutions with expert insights and AI powered tools for academic success

Step: 2

blur-text-image

Step: 3

blur-text-image

Ace Your Homework with AI

Get the answers you need in no time with our AI-driven, step-by-step assistance

Get Started

Recommended Textbook for

Precalculus Enhanced With Graphing Utilities (Subscription)

Authors: Michael, Michael Sullivan III, Michael III Sullivan, III Sullivan

6th Edition

0321849108, 9780321849106

More Books

Students also viewed these Mathematics questions