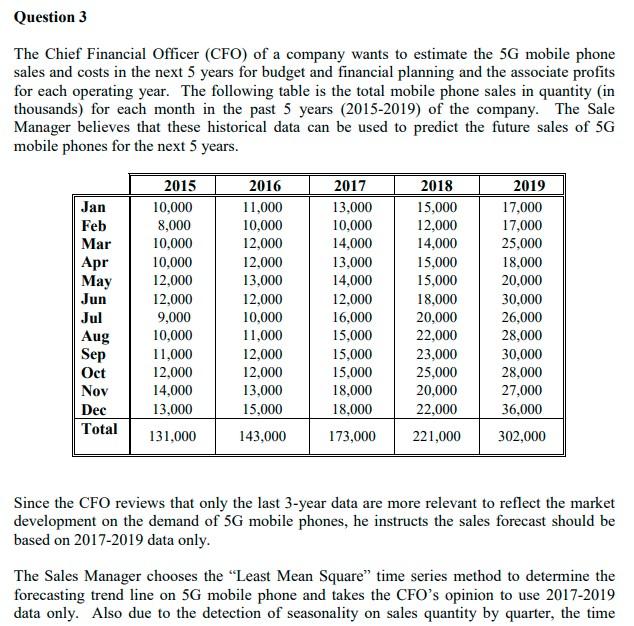
Question 3 The Chief Financial Officer (CFO) of a company wants to estimate the 5G mobile phone sales and costs in the next 5 years for budget and financial planning and the associate profits for each operating year. The following table is the total mobile phone sales in quantity (in thousands) for each month in the past 5 years (2015-2019) of the company. The Sale Manager believes that these historical data can be used to predict the future sales of 5G mobile phones for the next 5 years. Jan Feb Mar Apr | May Jun Jul Aug Sep Oct Nov Dec Total 2015 10,000 8,000 10,000 10,000 12,000 12,000 9,000 10,000 11,000 12,000 14,000 13,000 131,000 2016 11,000 10,000 12,000 12,000 13,000 12,000 10,000 11,000 12,000 12,000 13,000 15,000 143,000 2017 13,000 10,000 14,000 13,000 14,000 12,000 16,000 15,000 15,000 15.000 18,000 18,000 173,000 2018 15,000 12,000 14,000 15,000 15,000 18,000 20,000 22,000 23,000 25,000 20,000 22,000 221,000 2019 17,000 17,000 25,000 18,000 20,000 30,000 26,000 28,000 30,000 28.000 27,000 36,000 302,000 Since the CFO reviews that only the last 3-year data are more relevant to reflect the market development on the demand of 5G mobile phones, he instructs the sales forecast should be based on 2017-2019 data only. The Sales Manager chooses the Least Mean Square time series method to determine the forecasting trend line on 5G mobile phone and takes the CFO's opinion to use 2017-2019 data only. Also due to the detection of seasonality on sales quantity by quarter, the time interval will be based on quarters, Qtrl (Jan-Mar), Qtr2 (Apr-Jun), Qtr3 (Jul-Sep), and Qtr4 (Oct-Dec). Based on the above scenario, (a) Determine the forecasting trend line according to the Sales Manager's decision. (b) Calculate the forecast sales quantities for Qtr1, Qtr2, Qtr3 and Qtr4 in year 2024. (c) Determine the seasonal factors for each quarter using 2017-2019 data by the "Quarterly Average method and re-calculate (b.) by applying the seasonal adjusted factors. (d) What are the potential errors, name any 5 of them, which may exist in the above approach to forecast and what would mislead the CFO on his calculations? Question 3 The Chief Financial Officer (CFO) of a company wants to estimate the 5G mobile phone sales and costs in the next 5 years for budget and financial planning and the associate profits for each operating year. The following table is the total mobile phone sales in quantity (in thousands) for each month in the past 5 years (2015-2019) of the company. The Sale Manager believes that these historical data can be used to predict the future sales of 5G mobile phones for the next 5 years. Jan Feb Mar Apr | May Jun Jul Aug Sep Oct Nov Dec Total 2015 10,000 8,000 10,000 10,000 12,000 12,000 9,000 10,000 11,000 12,000 14,000 13,000 131,000 2016 11,000 10,000 12,000 12,000 13,000 12,000 10,000 11,000 12,000 12,000 13,000 15,000 143,000 2017 13,000 10,000 14,000 13,000 14,000 12,000 16,000 15,000 15,000 15.000 18,000 18,000 173,000 2018 15,000 12,000 14,000 15,000 15,000 18,000 20,000 22,000 23,000 25,000 20,000 22,000 221,000 2019 17,000 17,000 25,000 18,000 20,000 30,000 26,000 28,000 30,000 28.000 27,000 36,000 302,000 Since the CFO reviews that only the last 3-year data are more relevant to reflect the market development on the demand of 5G mobile phones, he instructs the sales forecast should be based on 2017-2019 data only. The Sales Manager chooses the Least Mean Square time series method to determine the forecasting trend line on 5G mobile phone and takes the CFO's opinion to use 2017-2019 data only. Also due to the detection of seasonality on sales quantity by quarter, the time interval will be based on quarters, Qtrl (Jan-Mar), Qtr2 (Apr-Jun), Qtr3 (Jul-Sep), and Qtr4 (Oct-Dec). Based on the above scenario, (a) Determine the forecasting trend line according to the Sales Manager's decision. (b) Calculate the forecast sales quantities for Qtr1, Qtr2, Qtr3 and Qtr4 in year 2024. (c) Determine the seasonal factors for each quarter using 2017-2019 data by the "Quarterly Average method and re-calculate (b.) by applying the seasonal adjusted factors. (d) What are the potential errors, name any 5 of them, which may exist in the above approach to forecast and what would mislead the CFO on his calculations