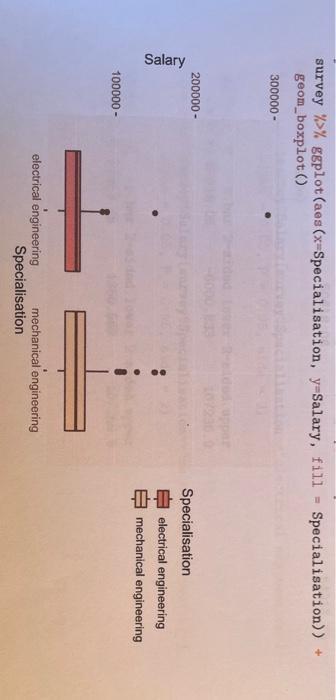
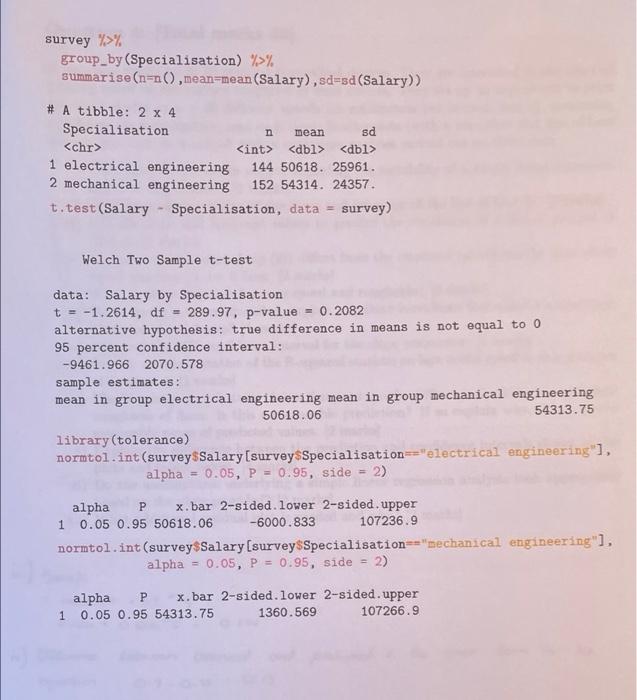
Question 3: [Total marks 30] A survey of electrical and mechanical engineers was performed to compare their salaries 10 years after graduation. You are asked to analyse these data to determine if there is a difference in average salary between the two specialisations. Appropriate plots and output are given below. ui E4 P en Me electrical cong and Mbt mechanicel en eng e) What information is provided by each of the Tolerance Intervals provided below? (4 marks f) What are the assumptions underlying cach of the intervals presented? (2 marks] g) Do the assumptions look justified based on the boxplot and numerical summaries provided? [2 marks] h) Explain the steps involved in calculating a bootstrap 95% confidence interval for the difference in mean salary between these two groups (6 marks] survey %>% geplot(aes (x-Specialisation, y=Salary, fill - Specialisation)) + geom_boxplot() 300000 - 200000- Salary Specialisation electrical engineering mechanical engineering 100000 - electrical engineering mechanical engineering Specialisation survey %>% group_by (Specialisation) %>% summarise (n=n(),mean-mean (Salary), sd-sd (Salary)) # A tibble: 2 x 4 Specialisation mean sd
1 electrical engineering 144 50618. 25961. 2 mechanical engineering 152 54314. 24357. t.test(Salary - Specialisation, data = survey) Welch Two Sample t-test data: Salary by Specialisation t = -1.2614, df = 289.97, p-value = 0.2082 alternative hypothesis: true difference in means is not equal to 0 95 percent confidence interval: -9461.966 2070.578 sample estimates: mean in group electrical engineering mean in group mechanical engineering 50618.06 54313.75 library(tolerance) normtol.int (survey Salary(survey Specialisation=-"electrical engineering"], alpha = 0.05, P = 0.95, side = 2) alpha P x.bar 2-sided lower 2-sided. upper 1 0.05 0.95 50618.06 -6000.833 107236.9 normtol.int (survey Salary(survey Specialisation=="mechanical engineering"], alpha = 0.05, P = 0.95, side = 2) alpha P x.bar 2-sided lower 2-sided upper 1 0.05 0.95 54313.75 1360.569 107266.9 Question 3: [Total marks 30] A survey of electrical and mechanical engineers was performed to compare their salaries 10 years after graduation. You are asked to analyse these data to determine if there is a difference in average salary between the two specialisations. Appropriate plots and output are given below. ui E4 P en Me electrical cong and Mbt mechanicel en eng e) What information is provided by each of the Tolerance Intervals provided below? (4 marks f) What are the assumptions underlying cach of the intervals presented? (2 marks] g) Do the assumptions look justified based on the boxplot and numerical summaries provided? [2 marks] h) Explain the steps involved in calculating a bootstrap 95% confidence interval for the difference in mean salary between these two groups (6 marks] survey %>% geplot(aes (x-Specialisation, y=Salary, fill - Specialisation)) + geom_boxplot() 300000 - 200000- Salary Specialisation electrical engineering mechanical engineering 100000 - electrical engineering mechanical engineering Specialisation survey %>% group_by (Specialisation) %>% summarise (n=n(),mean-mean (Salary), sd-sd (Salary)) # A tibble: 2 x 4 Specialisation mean sd 1 electrical engineering 144 50618. 25961. 2 mechanical engineering 152 54314. 24357. t.test(Salary - Specialisation, data = survey) Welch Two Sample t-test data: Salary by Specialisation t = -1.2614, df = 289.97, p-value = 0.2082 alternative hypothesis: true difference in means is not equal to 0 95 percent confidence interval: -9461.966 2070.578 sample estimates: mean in group electrical engineering mean in group mechanical engineering 50618.06 54313.75 library(tolerance) normtol.int (survey Salary(survey Specialisation=-"electrical engineering"], alpha = 0.05, P = 0.95, side = 2) alpha P x.bar 2-sided lower 2-sided. upper 1 0.05 0.95 50618.06 -6000.833 107236.9 normtol.int (survey Salary(survey Specialisation=="mechanical engineering"], alpha = 0.05, P = 0.95, side = 2) alpha P x.bar 2-sided lower 2-sided upper 1 0.05 0.95 54313.75 1360.569 107266.9


