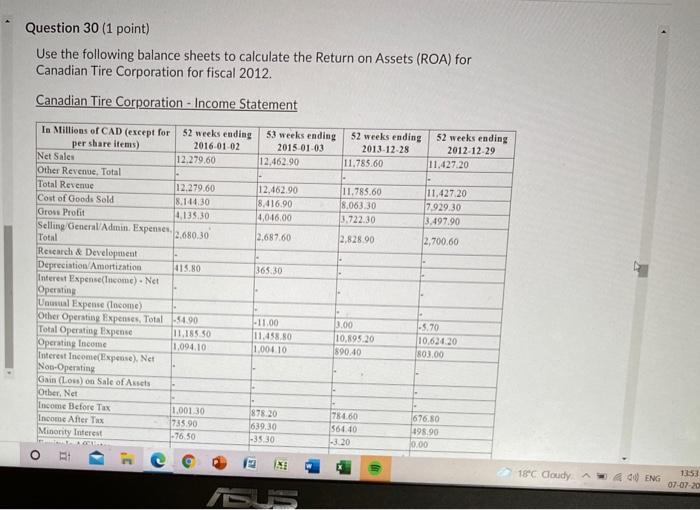
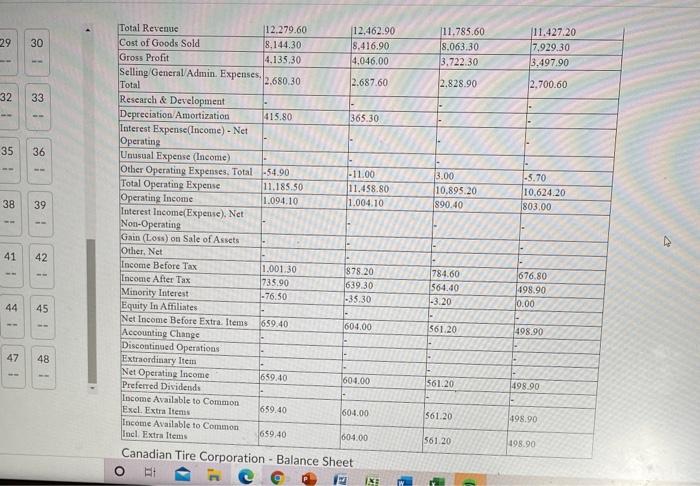
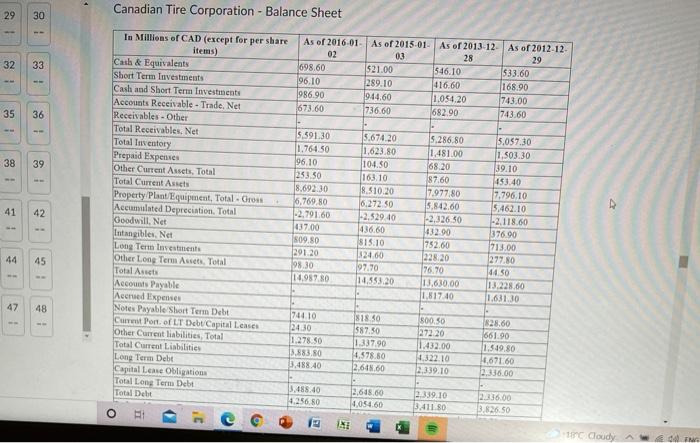
Question 30 (1 point) Use the following balance sheets to calculate the Return on Assets (ROA) for Canadian Tire Corporation for fiscal 2012. Canadian Tire Corporation - Income Statement In Millions of CAD (except for 52 weeks ending 53 weeks ending 52 weeks ending 52 weeks ending per share items) 2016-01-02 2015.01-03 2013-12-28 2012-12-29 Net Sales 12.279.60 12.462.90 11.785.60 11.427.20 Other Revenue, Total Total Revenue 12.279.60 12.462.90 11.785.60 11,427.20 Cost of Goods Sold 8.144.30 8.416.90 8.063.30 7.929.30 Gross Profit 4,135.30 4,016,00 3.722.30 3.497.90 Selling General Admin. Expenses Total 2.680.30 2.687.60 2,828.90 2,700.60 Research & Development Depreciation Amortization 415.80 365.30 Interest Expense(come). Net Operating Unusual Expense (tocome) Other Operating Expenses. Total 54,90 -11.00 3.00 -5.70 Total Operating Expense 11,185 50 11.498.80 10.895.20 10.620.20 Operating Income 1,094.10 1.004.10 $90.40 803.00 Interest Income Expense). Net Non-Operating Gain (Loss) on Sale of Assets Other Net Income Before Tax 1.00130 878.20 784.60 676.80 Income After Tax 735.90 639.30 56410 195.90 Minority Interest - 76.50 -3530 - 20 0.00 o 18C Goudy A400 ENG 1353 07-07-20 29 30 111.785.60 8.063.30 3.722.30 11.427.20 7.929.30 3.497.90 2.828.90 2.700.60 32 33 35 36 3.00 10.895.20 890.40 -5.70 10.624.20 803,00 38 39 Total Revenue 12.279.60 12.462.90 Cost of Goods Sold 8.144.30 8.416.90 Gross Profit 4.135.30 4,046,00 Selling General Admin. Expenses. 2.680.30 2.687.60 Total Research & Development Depreciation Amortization 415.80 365.30 Interest Expense(Income) - Net Operating Unusual Expense (Income) Other Operating Expenses. Total -54.90 -11.00 Total Operating Expense 11.185.50 11.458.80 Operating Income 1.094.10 1.004.10 Interest Income Expense). Net Non-Operating Gain (Loss) on Sale of Assets Other Net Income Before Tax 1.001.30 878.20 Income After Tax 735.90 639.30 Minority Interest -76.50 -35.30 Equity In Affiliates Net Income Before Extra Items 659.40 604.00 Accounting Change Discontinued Operations Extraordinary Item Net Operating Income 659.40 604.00 Preferred Dividends Income Available to Common Excl. Extra Items 659.40 604.00 Income Available to Common Incl. Extra Items 659.40 604.00 Canadian Tire Corporation - Balance Sheet BE IX 41 42 784.60 564.40 -3.20 676.80 498.90 10.00 44 45 561.20 498.90 47 48 561.20 498.00 561.20 198.90 561.20 198.90 c . Canadian Tire Corporation - Balance Sheet 29 30 32 33 As of 2016 01. As of 2015-01- As of 2013-12- As of 2012-12- 02 03 28 29 698.60 $21.00 546.10 533.60 196.10 289.10 416.60 168.90 986.90 9:44.60 1.054.20 743.00 673.60 736.60 682.90 743.60 35 36 5.286.80 1.481.00 68.20 38 39 87.60 5.591.30 1.764.50 96.10 253 50 8.692.30 6,769.80 -2.791.60 47.00 809.80 291.20 98.30 14.987.80 41 In Millions of CAD (except for per share items) Cash & Equivalents Short Term Investments Cash and Short Term Investments Accounts Receivable - Trade. Net Receivables - Other Total Receivables, Net Total Inventory Prepaid Expenses Other Current Assets, Total Total Current Assets Property Plant Equipment, Total Grou Accumulated Depreciation. Total Goodwill, Net Intangibles, Net Long Term Investments Other Long Term Assets. Total Total Arts Accounts Payable Accred Expenses Notes Payable Short Term Debt Cut Port of LT Debt Capital Lease Other Current liabilities, Total Total Current Liabilities Long Term Debt Capital Lease Obligations Total Long Term Debt Total Debt 42 5.674,20 1.623.80 104.50 163.10 8.510.20 6.27250 -2.529.40 436.60 815.10 $24.60 97.70 14,353.20 7.977.80 5.842.60 -2,326.50 1432.90 752.60 228 20 76.70 13,630.00 1.817.40 5,057.30 1,303.30 39.10 45.40 7.796,10 5.462.10 -2.118.60 376.90 713.00 277.80 4450 13.228.60 1.631.30 44 45 47 48 744 10 2430 1.278.50 3.583.80 3.488.40 818.30 587.50 1.337.90 4.578.80 2.611 60 500.50 27220 1.432.00 1.322.10 2,339.10 $28.00 661.90 1.319.80 H.671.60 336.00 3.485.40 4.256.50 2.615.60 4,054.60 22339.10 3.411 80 22136.00 3.826.50 19 NE ng Cloudy