Question 39& 40 please.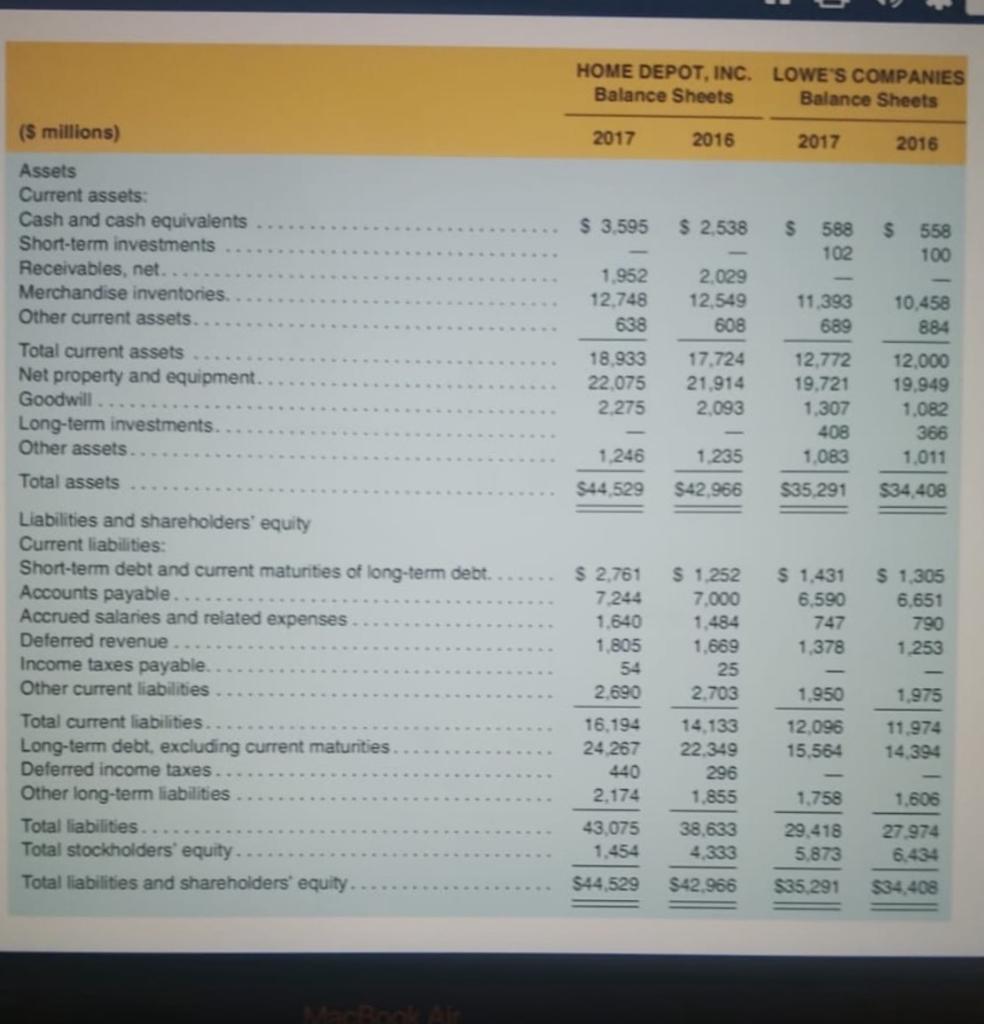
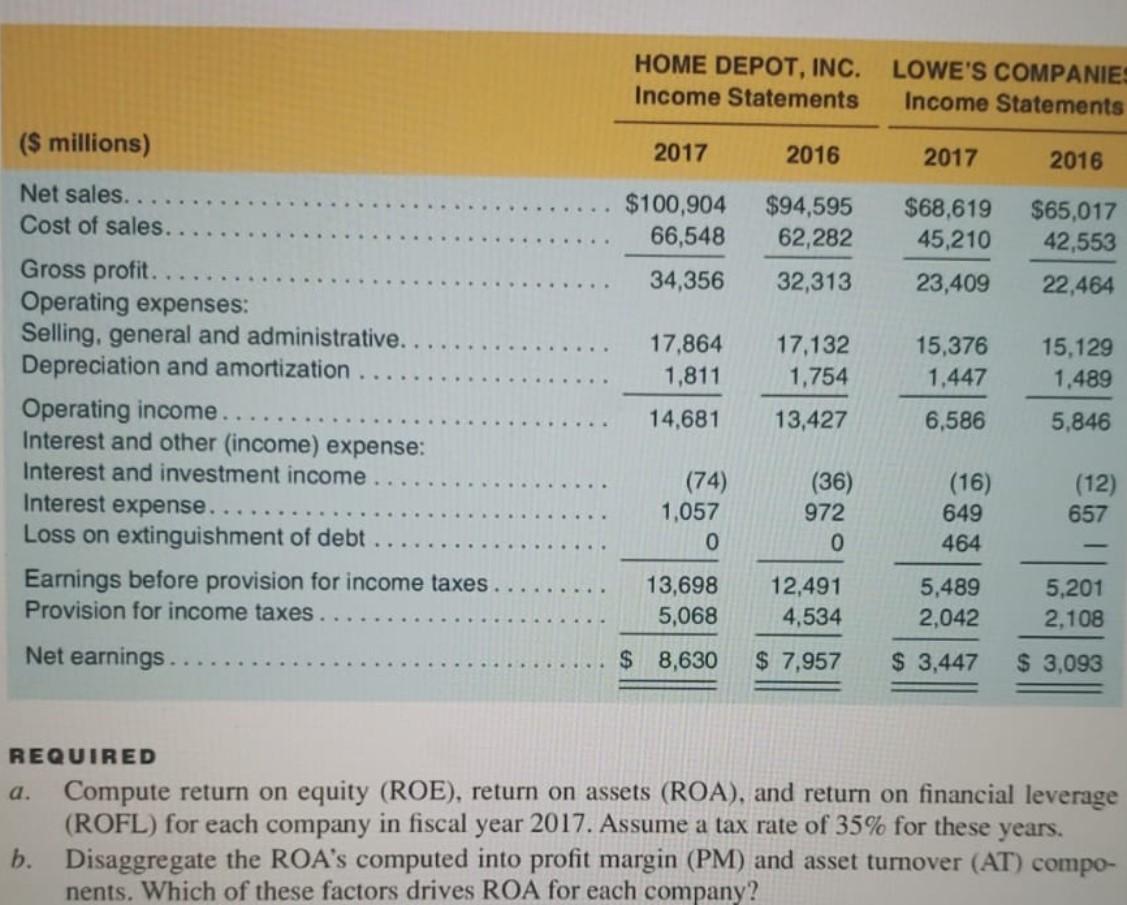
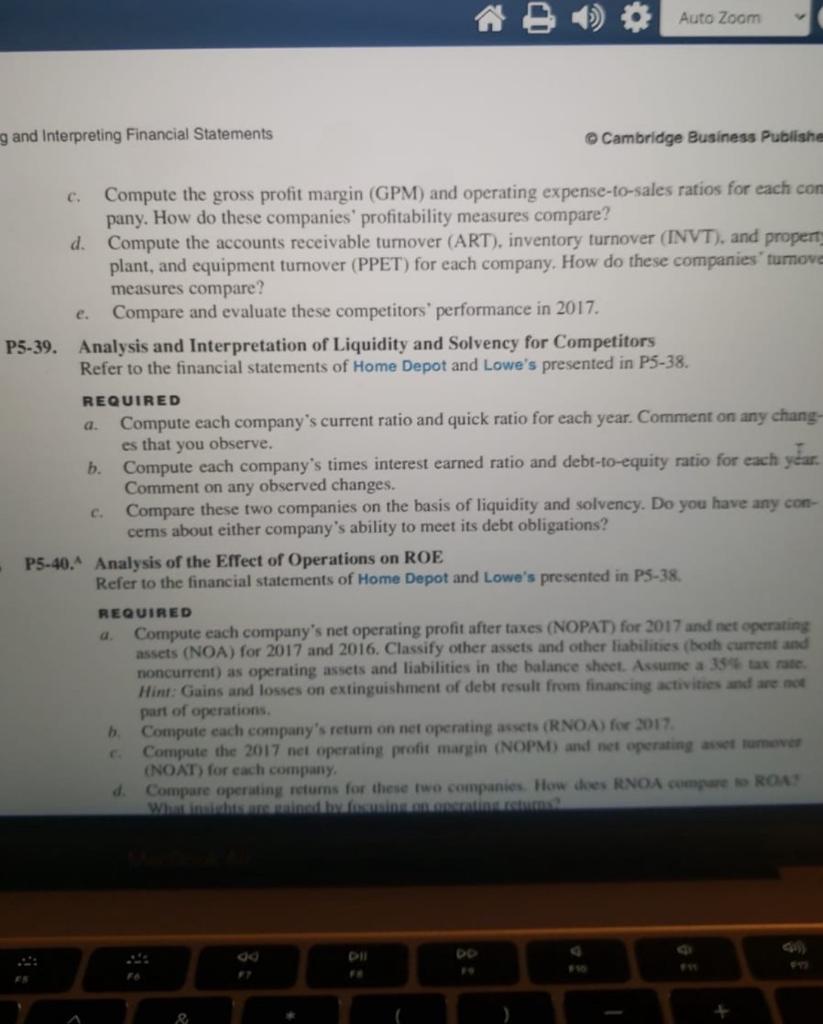
Auto Zoom g and Interpreting Financial Statements Cambridge Business Publishe Compute the gross profit margin (GPM) and operating expense-to-sales ratios for each com pany. How do these companies' profitability measures compare? d. Compute the accounts receivable turnover (ART), inventory turnover (INVT), and property plant, and equipment turnover (PPET) for each company. How do these companies' tumove measures compare? Compare and evaluate these competitors' performance in 2017. P5-39. Analysis and Interpretation of Liquidity and Solvency for Competitors Refer to the financial statements of Home Depot and Lowe's presented in P5-38. REQUIRED Compute each company's current ratio and quick ratio for each year. Comment on any chang- es that you observe. b. Compute each company's times interest arned ratio and debt-to-equity ratio for each year, Comment on any observed changes. Compare these two companies on the basis of liquidity and solvency. Do you have any con- cerns about either company's ability to meet its debt obligations? P5-40. Analysis of the Effect of Operations on ROE Refer to the financial statements of Home Depot and Lowe's presented in PS-38. REQUIRED Compute each company's net operating profit after taxes (NOPAT) for 2017 and net operating assets (NOA) for 2017 and 2016. Classify other assets and other fiabilities (both current and noncurrent) as operating assets and liabilities in the balance sheet. Assume a 35 tax rate Hint: Gains and losses on extinguishment of debt result from financing activities and are not part of operations b Compute each company's return on net operating assets (RNOA) for 2017 Compute the 2017 net operating profit margin (NOPM) and net operating asset tumeve (NOAT) for each company d. Compare operating retums for these two companies. How does RNOA comp ROA c. Dll & HOME DEPOT, INC. LOWE'S COMPANIES Balance Sheets Balance Sheets (5 millions) 2017 2016 2017 2016 $ 3.595 $ 2.538 S Assets Current assets: Cash and cash equivalents Short-term investments Receivables, net. Merchandise inventories Other current assets. 588 102 $ 558 100 1.952 12.748 638 2.029 12.549 608 11.393 689 10.458 884 Total current assets Net property and equipment. Goodwill. Long-term investments. Other assets 18,933 22.075 2.275 17.724 21.914 2.093 12.772 19.721 1.307 408 1,083 12.000 19,949 1.082 366 1.011 1.246 1.235 Total assets $44.529 $42.966 $35.291 $34.408 $ 2,761 7244 1.640 1.805 54 2.690 $ 1.431 6.590 747 1.378 Liabilities and shareholders' equity Current liabilities: Short-term debt and current matunities of long-term debt. Accounts payable Accrued salaries and related expenses Deferred revenue Income taxes payable. Other current liabilities Total current liabilities. Long-term debt, excluding current matunties Deferred income taxes. Other long-term liabilities Total liabilities... Total stockholders' equity Total liabilities and shareholders' equity. S 1.305 6.651 790 1.253 1.975 $ 1.252 7.000 1,484 1.669 25 2.703 14.133 22.349 296 1.855 38.633 4.333 $42.966 1,950 12.096 15.564 16.194 24.267 440 2.174 43,075 1.454 11.974 14.394 1.758 1.606 29.418 5.873 $35.291 27.974 6.434 $34.408 $44.529 HOME DEPOT, INC. Income Statements LOWE'S COMPANIES Income Statements ($ millions) 2017 2016 2017 2016 Net sales.. Cost of sales. $100,904 66,548 34,356 $94,595 62,282 32,313 $68,619 45,210 23,409 $65,017 42,553 22,464 17,864 1,811 17,132 1,754 15,376 1,447 15,129 1,489 14,681 13,427 6,586 5.846 Gross profit. Operating expenses: Selling, general and administrative.. Depreciation and amortization Operating income...... Interest and other (income) expense: Interest and investment income Interest expense..... Loss on extinguishment of debt Earnings before provision for income taxes. Provision for income taxes (74) 1,057 o (36) 972 0 (16) 649 464 (12) 657 13,698 5,068 12,491 4,534 5,489 2,042 5,201 2.108 Net earnings .. $ 8,630 $ 7,957 $ 3,447 $ 3,093 a. REQUIRED Compute return on equity (ROE), return on assets (ROA), and return on financial leverage (ROFL) for each company in fiscal year 2017. Assume a tax rate of 35% for these years. b. Disaggregate the ROA's computed into profit margin (PM) and asset turnover (AT) compo- nents. Which of these factors drives ROA for each company? Auto Zoom g and Interpreting Financial Statements Cambridge Business Publishe Compute the gross profit margin (GPM) and operating expense-to-sales ratios for each com pany. How do these companies' profitability measures compare? d. Compute the accounts receivable turnover (ART), inventory turnover (INVT), and property plant, and equipment turnover (PPET) for each company. How do these companies' tumove measures compare? Compare and evaluate these competitors' performance in 2017. P5-39. Analysis and Interpretation of Liquidity and Solvency for Competitors Refer to the financial statements of Home Depot and Lowe's presented in P5-38. REQUIRED Compute each company's current ratio and quick ratio for each year. Comment on any chang- es that you observe. b. Compute each company's times interest arned ratio and debt-to-equity ratio for each year, Comment on any observed changes. Compare these two companies on the basis of liquidity and solvency. Do you have any con- cerns about either company's ability to meet its debt obligations? P5-40. Analysis of the Effect of Operations on ROE Refer to the financial statements of Home Depot and Lowe's presented in PS-38. REQUIRED Compute each company's net operating profit after taxes (NOPAT) for 2017 and net operating assets (NOA) for 2017 and 2016. Classify other assets and other fiabilities (both current and noncurrent) as operating assets and liabilities in the balance sheet. Assume a 35 tax rate Hint: Gains and losses on extinguishment of debt result from financing activities and are not part of operations b Compute each company's return on net operating assets (RNOA) for 2017 Compute the 2017 net operating profit margin (NOPM) and net operating asset tumeve (NOAT) for each company d. Compare operating retums for these two companies. How does RNOA comp ROA c. Dll & HOME DEPOT, INC. LOWE'S COMPANIES Balance Sheets Balance Sheets (5 millions) 2017 2016 2017 2016 $ 3.595 $ 2.538 S Assets Current assets: Cash and cash equivalents Short-term investments Receivables, net. Merchandise inventories Other current assets. 588 102 $ 558 100 1.952 12.748 638 2.029 12.549 608 11.393 689 10.458 884 Total current assets Net property and equipment. Goodwill. Long-term investments. Other assets 18,933 22.075 2.275 17.724 21.914 2.093 12.772 19.721 1.307 408 1,083 12.000 19,949 1.082 366 1.011 1.246 1.235 Total assets $44.529 $42.966 $35.291 $34.408 $ 2,761 7244 1.640 1.805 54 2.690 $ 1.431 6.590 747 1.378 Liabilities and shareholders' equity Current liabilities: Short-term debt and current matunities of long-term debt. Accounts payable Accrued salaries and related expenses Deferred revenue Income taxes payable. Other current liabilities Total current liabilities. Long-term debt, excluding current matunties Deferred income taxes. Other long-term liabilities Total liabilities... Total stockholders' equity Total liabilities and shareholders' equity. S 1.305 6.651 790 1.253 1.975 $ 1.252 7.000 1,484 1.669 25 2.703 14.133 22.349 296 1.855 38.633 4.333 $42.966 1,950 12.096 15.564 16.194 24.267 440 2.174 43,075 1.454 11.974 14.394 1.758 1.606 29.418 5.873 $35.291 27.974 6.434 $34.408 $44.529 HOME DEPOT, INC. Income Statements LOWE'S COMPANIES Income Statements ($ millions) 2017 2016 2017 2016 Net sales.. Cost of sales. $100,904 66,548 34,356 $94,595 62,282 32,313 $68,619 45,210 23,409 $65,017 42,553 22,464 17,864 1,811 17,132 1,754 15,376 1,447 15,129 1,489 14,681 13,427 6,586 5.846 Gross profit. Operating expenses: Selling, general and administrative.. Depreciation and amortization Operating income...... Interest and other (income) expense: Interest and investment income Interest expense..... Loss on extinguishment of debt Earnings before provision for income taxes. Provision for income taxes (74) 1,057 o (36) 972 0 (16) 649 464 (12) 657 13,698 5,068 12,491 4,534 5,489 2,042 5,201 2.108 Net earnings .. $ 8,630 $ 7,957 $ 3,447 $ 3,093 a. REQUIRED Compute return on equity (ROE), return on assets (ROA), and return on financial leverage (ROFL) for each company in fiscal year 2017. Assume a tax rate of 35% for these years. b. Disaggregate the ROA's computed into profit margin (PM) and asset turnover (AT) compo- nents. Which of these factors drives ROA for each company