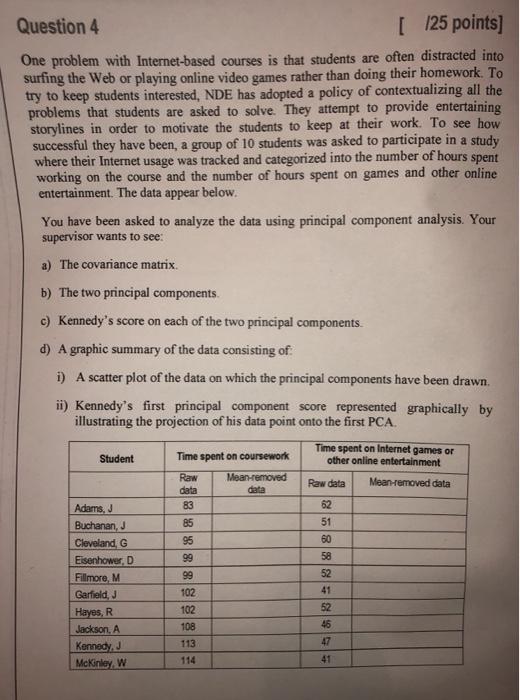
Question 4 [ 125 points) One problem with Internet-based courses is that students are often distracted into surfing the Web or playing online video games rather than doing their homework. To try to keep students interested, NDE has adopted a policy of contextualizing all the problems that students are asked to solve. They attempt to provide entertaining storylines in order to motivate the students to keep at their work. To see how successful they have been, a group of 10 students was asked to participate in a study where their Internet usage was tracked and categorized into the number of hours spent working on the course and the number of hours spent on games and other online entertainment. The data appear below. You have been asked to analyze the data using principal component analysis. Your supervisor wants to see: a) The covariance matrix. b) The two principal components c) Kennedy's score on each of the two principal components d) A graphic summary of the data consisting of: 1) A scatter plot of the data on which the principal components have been drawn. ii) Kennedy's first principal component score represented graphically by illustrating the projection of his data point onto the first PCA. Student Time spent on coursework Time spent on Internet games or other online entertainment Mean-removed data Raw data Meanremoved data Adams, Buchanan, J Cleveland, G Eisenhower, D Fillmore, M Garfield, J Hayes, R Jackson. A Kennedy McKinley W Raw data 83 85 95 99 99 102 102 108 113 62 51 60 58 52 41 52 46 47 41 Question 4 [ 125 points) One problem with Internet-based courses is that students are often distracted into surfing the Web or playing online video games rather than doing their homework. To try to keep students interested, NDE has adopted a policy of contextualizing all the problems that students are asked to solve. They attempt to provide entertaining storylines in order to motivate the students to keep at their work. To see how successful they have been, a group of 10 students was asked to participate in a study where their Internet usage was tracked and categorized into the number of hours spent working on the course and the number of hours spent on games and other online entertainment. The data appear below. You have been asked to analyze the data using principal component analysis. Your supervisor wants to see: a) The covariance matrix. b) The two principal components c) Kennedy's score on each of the two principal components d) A graphic summary of the data consisting of: 1) A scatter plot of the data on which the principal components have been drawn. ii) Kennedy's first principal component score represented graphically by illustrating the projection of his data point onto the first PCA. Student Time spent on coursework Time spent on Internet games or other online entertainment Mean-removed data Raw data Meanremoved data Adams, Buchanan, J Cleveland, G Eisenhower, D Fillmore, M Garfield, J Hayes, R Jackson. A Kennedy McKinley W Raw data 83 85 95 99 99 102 102 108 113 62 51 60 58 52 41 52 46 47 41