

Answered step by step
Verified Expert Solution
Question
1 Approved Answer
Question 4 (25 points) A football player punts a football such that the graph at the right shows the height of the ball in
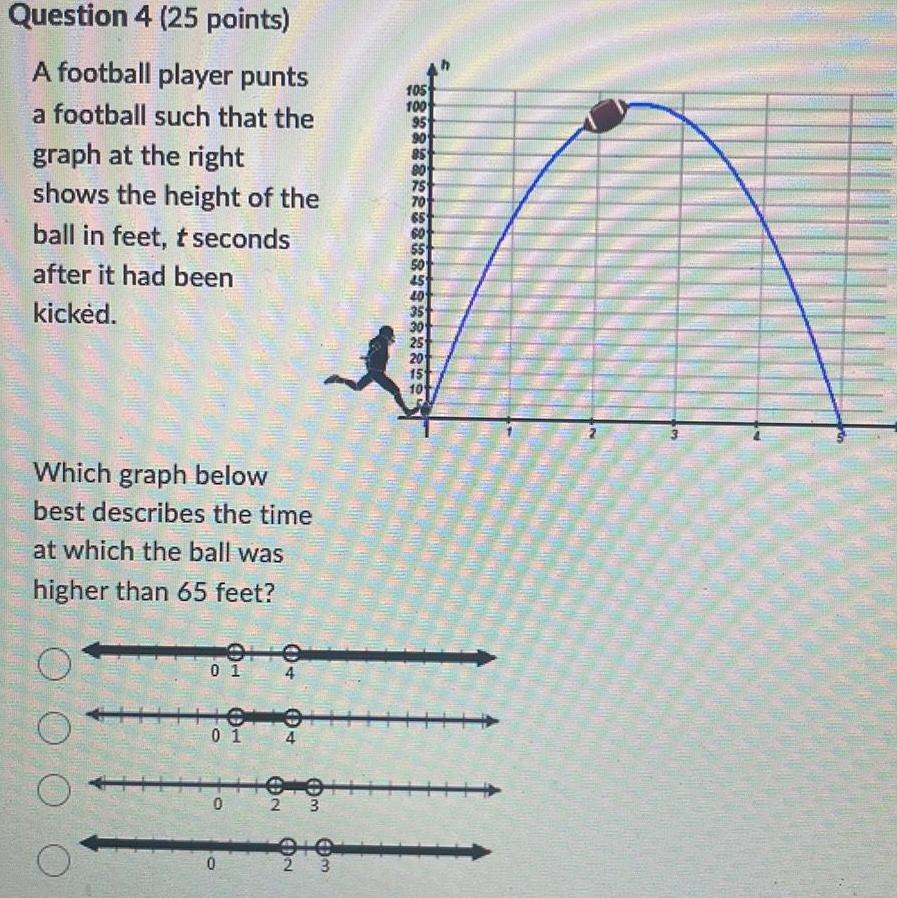
Question 4 (25 points) A football player punts a football such that the graph at the right shows the height of the ball in feet, t seconds 105 100 95 90 85 80 60 after it had been kicked. Which graph below best describes the time at which the ball was higher than 65 feet? O ele 01 4 01 4 0 1101011 0 2 3 010 2 3 55 50 40 35 30 25 20 15 10
Step by Step Solution
There are 3 Steps involved in it
Step: 1

Get Instant Access to Expert-Tailored Solutions
See step-by-step solutions with expert insights and AI powered tools for academic success
Step: 2

Step: 3
Ace Your Homework with AI
Get the answers you need in no time with our AI-driven, step-by-step assistance
Get Started
A Survey of Mathematics with Applications
Authors: Allen R. Angel, Christine D. Abbott, Dennis Runde
10th edition
134112105, 134112342, 9780134112343, 9780134112268, 134112261, 978-0134112107