Answered step by step
Verified Expert Solution
Link Copied!

Question

1 Approved Answer

Question 4 (25 points) An activity graph for a software development project is shown in Figure 1. The number corresponding to each edge of the
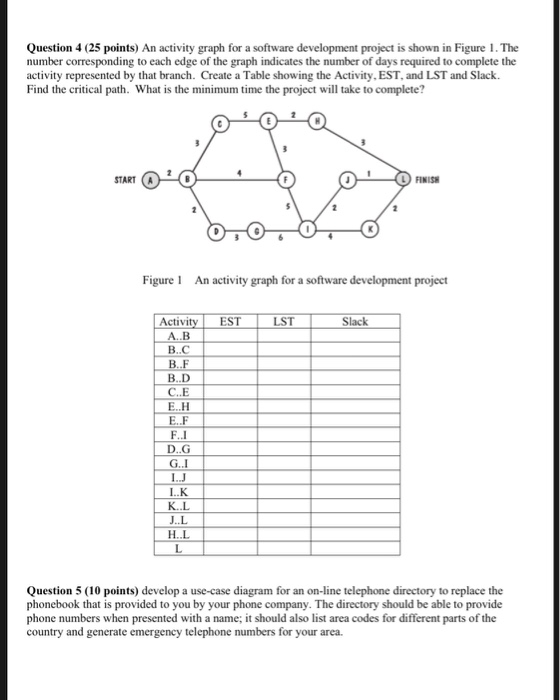
image text in transcribed
Question 4 (25 points) An activity graph for a software development project is shown in Figure 1. The number corresponding to each edge of the graph indicates the number of days required to complete the activity represented by that branch. Create a Table showing the Activity, EST, and LST and Slack Find the critical path. What is the minimum time the project will take to complete? STARTA FINISH Figure 1 An activity graph for a software development project Activ EST LST Slack B..C B..D C..E E..H E..F F.I D..G I..J I..K K..L H..L Question 5 (10 points) develop a use-case diagram for an on-line telephone directory to replace the phonebook that is provided to you by your phone company. The directory should be able to provide phone numbers when presented with a name; it should also list area codes for different parts of the country and generate emergency telephone numbers for your area

Step by Step Solution

There are 3 Steps involved in it

Step: 1

blur-text-image

Get Instant Access to Expert-Tailored Solutions

See step-by-step solutions with expert insights and AI powered tools for academic success

Step: 2

blur-text-image

Step: 3

blur-text-image

Ace Your Homework with AI

Get the answers you need in no time with our AI-driven, step-by-step assistance

Get Started

Recommended Textbook for

Students also viewed these Databases questions

Question

Challenges Facing Todays Organizations?

Answered: 1 week ago