

Answered step by step
Verified Expert Solution
Question
1 Approved Answer
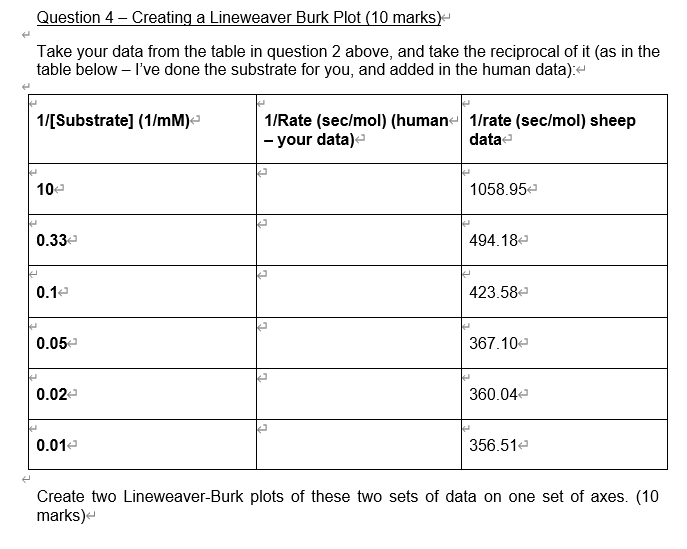
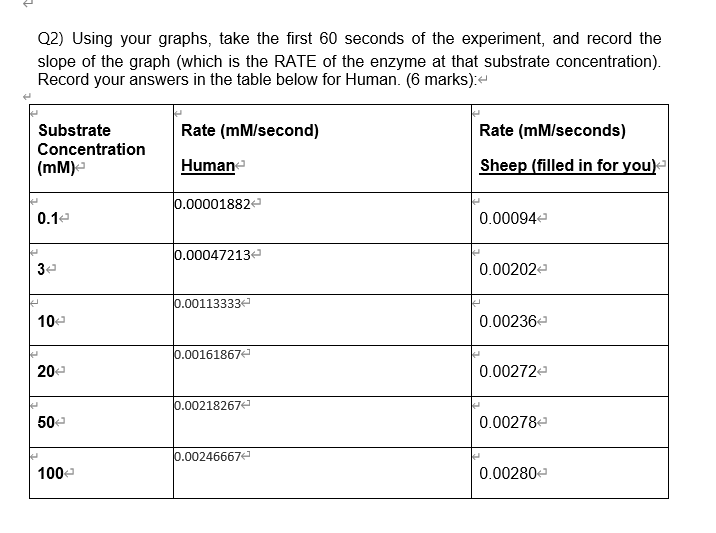
Question 4 - Creating a Lineweaver Burk Plot (10 marks) Take your data from the table in question 2 above, and take the reciprocal of
Step by Step Solution
There are 3 Steps involved in it
Step: 1

Get Instant Access to Expert-Tailored Solutions
See step-by-step solutions with expert insights and AI powered tools for academic success
Step: 2

Step: 3
Ace Your Homework with AI
Get the answers you need in no time with our AI-driven, step-by-step assistance
Get Started
Separation process principles
Authors: J. D. Seader
2nd Edition
471464805, 978-0471464808