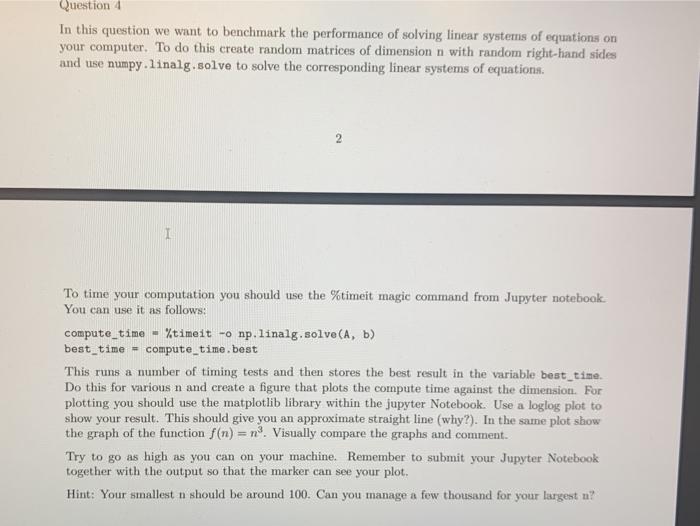
Question 4 In this question we want to benchmark the performance of solving linear systems of equations on your computer. To do this create random matrices of dimension n with random right-hand sides and use numpy.linalg,solve to solve the corresponding linear systems of equations. 2 1 To time your computation you should use the %timeit magic command from Jupyter notebook You can use it as follows: compute_time %timeit -o np. linalg.solve(A,b) best_time = compute_time. best This runs a number of timing tests and then stores the best result in the variable best_time. Do this for various n and create a figure that plots the compute time against the dimension. For plotting you should use the matplotlib library within the jupyter Notebook. Use a loglog plot to show your result. This should give you an approximate straight line (why?). In the same plot show the graph of the function f(n) = n! Visually compare the graphs and comment. Try to go as high as you can on your machine. Remember to submit your Jupyter Notebook together with the output so that the marker can see your plot. Hint: Your smallest n should be around 100. Can you manage a few thousand for your largest n? Question 4 In this question we want to benchmark the performance of solving linear systems of equations on your computer. To do this create random matrices of dimension n with random right-hand sides and use numpy.linalg,solve to solve the corresponding linear systems of equations. 2 1 To time your computation you should use the %timeit magic command from Jupyter notebook You can use it as follows: compute_time %timeit -o np. linalg.solve(A,b) best_time = compute_time. best This runs a number of timing tests and then stores the best result in the variable best_time. Do this for various n and create a figure that plots the compute time against the dimension. For plotting you should use the matplotlib library within the jupyter Notebook. Use a loglog plot to show your result. This should give you an approximate straight line (why?). In the same plot show the graph of the function f(n) = n! Visually compare the graphs and comment. Try to go as high as you can on your machine. Remember to submit your Jupyter Notebook together with the output so that the marker can see your plot. Hint: Your smallest n should be around 100. Can you manage a few thousand for your largest n


