

Answered step by step
Verified Expert Solution
Question
1 Approved Answer
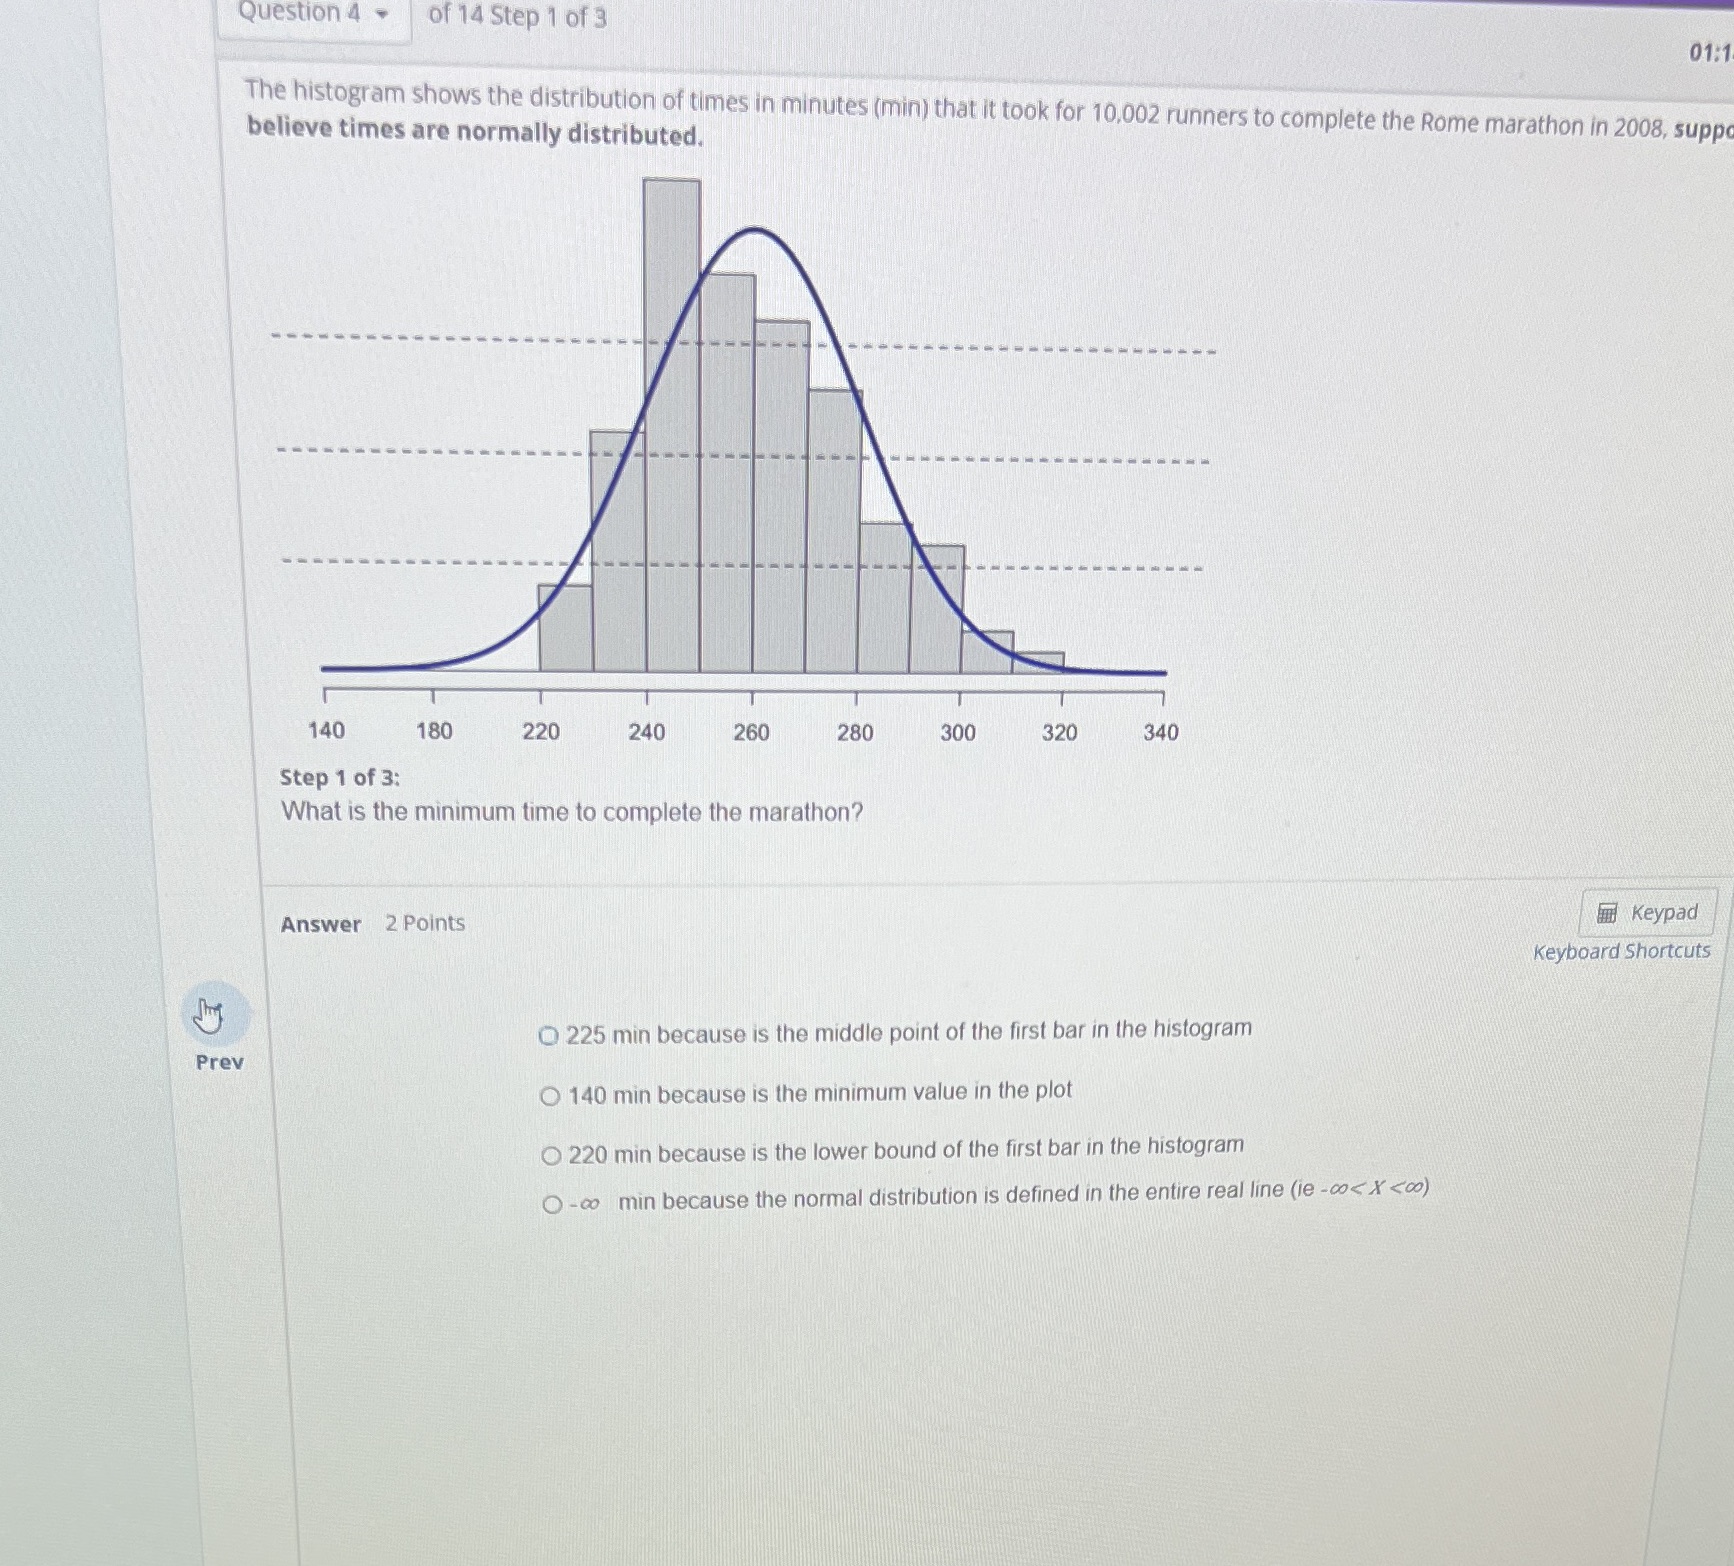
Question 4 of 14 Step 1 of 3 01:1 The histogram shows the distribution of times in minutes (min) that it took for 10,002 runners
Step by Step Solution
There are 3 Steps involved in it
Step: 1

Get Instant Access to Expert-Tailored Solutions
See step-by-step solutions with expert insights and AI powered tools for academic success
Step: 2

Step: 3
Ace Your Homework with AI
Get the answers you need in no time with our AI-driven, step-by-step assistance
Get Started
Exercises In Computational Mathematics With MATLAB
Authors: Tom Lyche, Jean Louis Merrien
1st Edition
366243511X, 9783662435113