Answered step by step
Verified Expert Solution
Link Copied!

Question

1 Approved Answer

Question 4. Question 4 [12 points] The graph below shows the economy of China. Planned Aggregate Expenditures 2400 2100 1800- 1500 Real aggregate expenditures (in

Question 4.
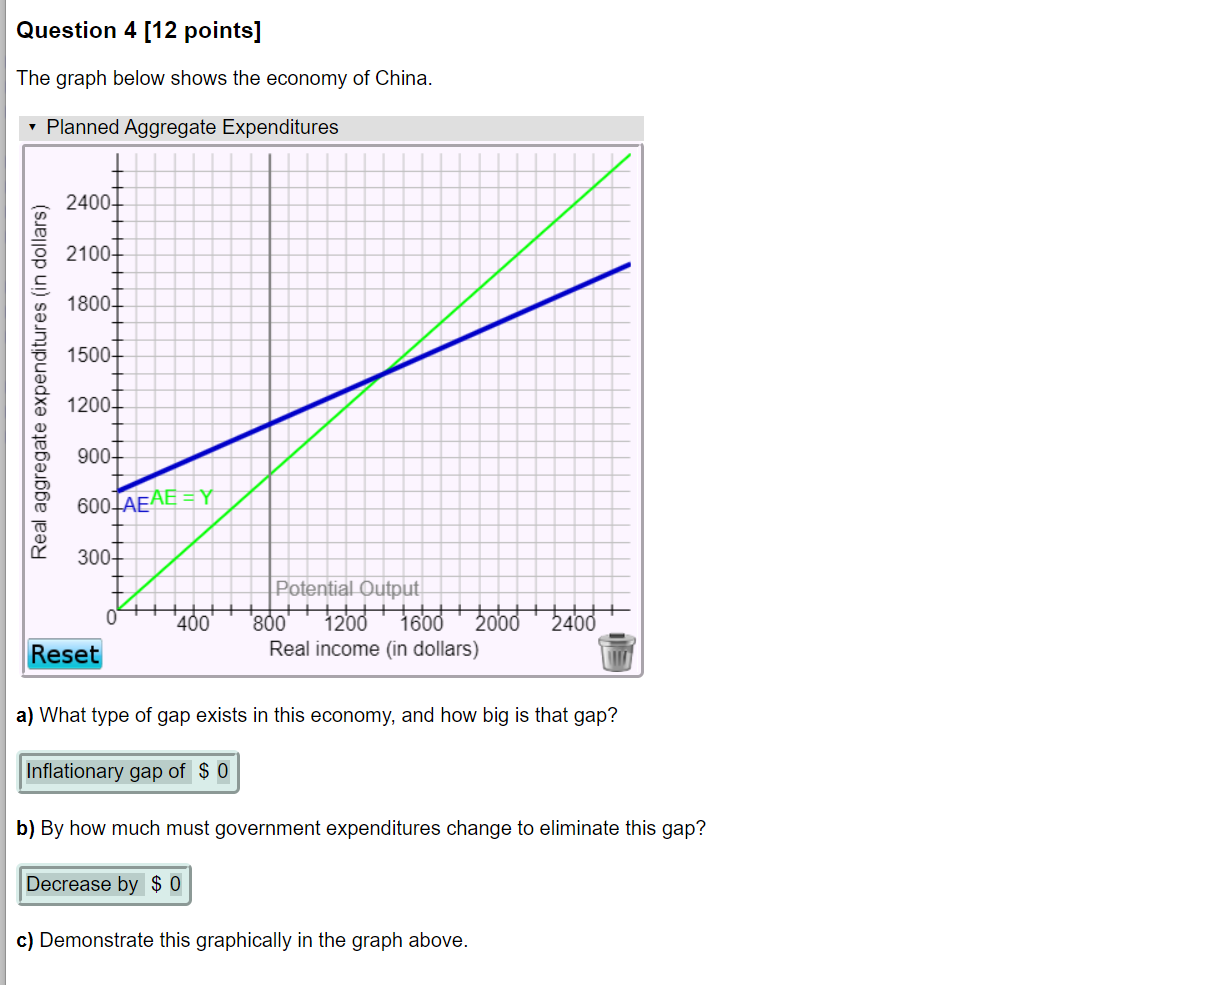
image text in transcribed
Question 4 [12 points] The graph below shows the economy of China. Planned Aggregate Expenditures 2400 2100 1800- 1500 Real aggregate expenditures (in dollars) 1200 9007 600-AEALEY 300 Potential Output 400 800 1200 1600 2000 2400 Reset Real income (in dollars) a) What type of gap exists in this economy, and how big is that gap? Inflationary gap of $ 0 b) By how much must government expenditures change to eliminate this gap? Decrease by $ 0 c) Demonstrate this graphically in the graph above

Step by Step Solution

There are 3 Steps involved in it

Step: 1

blur-text-image

Get Instant Access to Expert-Tailored Solutions

See step-by-step solutions with expert insights and AI powered tools for academic success

Step: 2

blur-text-image

Step: 3

blur-text-image

Ace Your Homework with AI

Get the answers you need in no time with our AI-driven, step-by-step assistance

Get Started

Recommended Textbook for

Principles of economics

Authors: N. Gregory Mankiw

6th Edition

978-0538453059, 9781435462120, 538453052, 1435462122, 978-0538453042

More Books

Students also viewed these Economics questions

Question

LO2.6 Explain how the market system deals with risk.

Answered: 1 week ago