Answered step by step
Verified Expert Solution
Question
1 Approved Answer
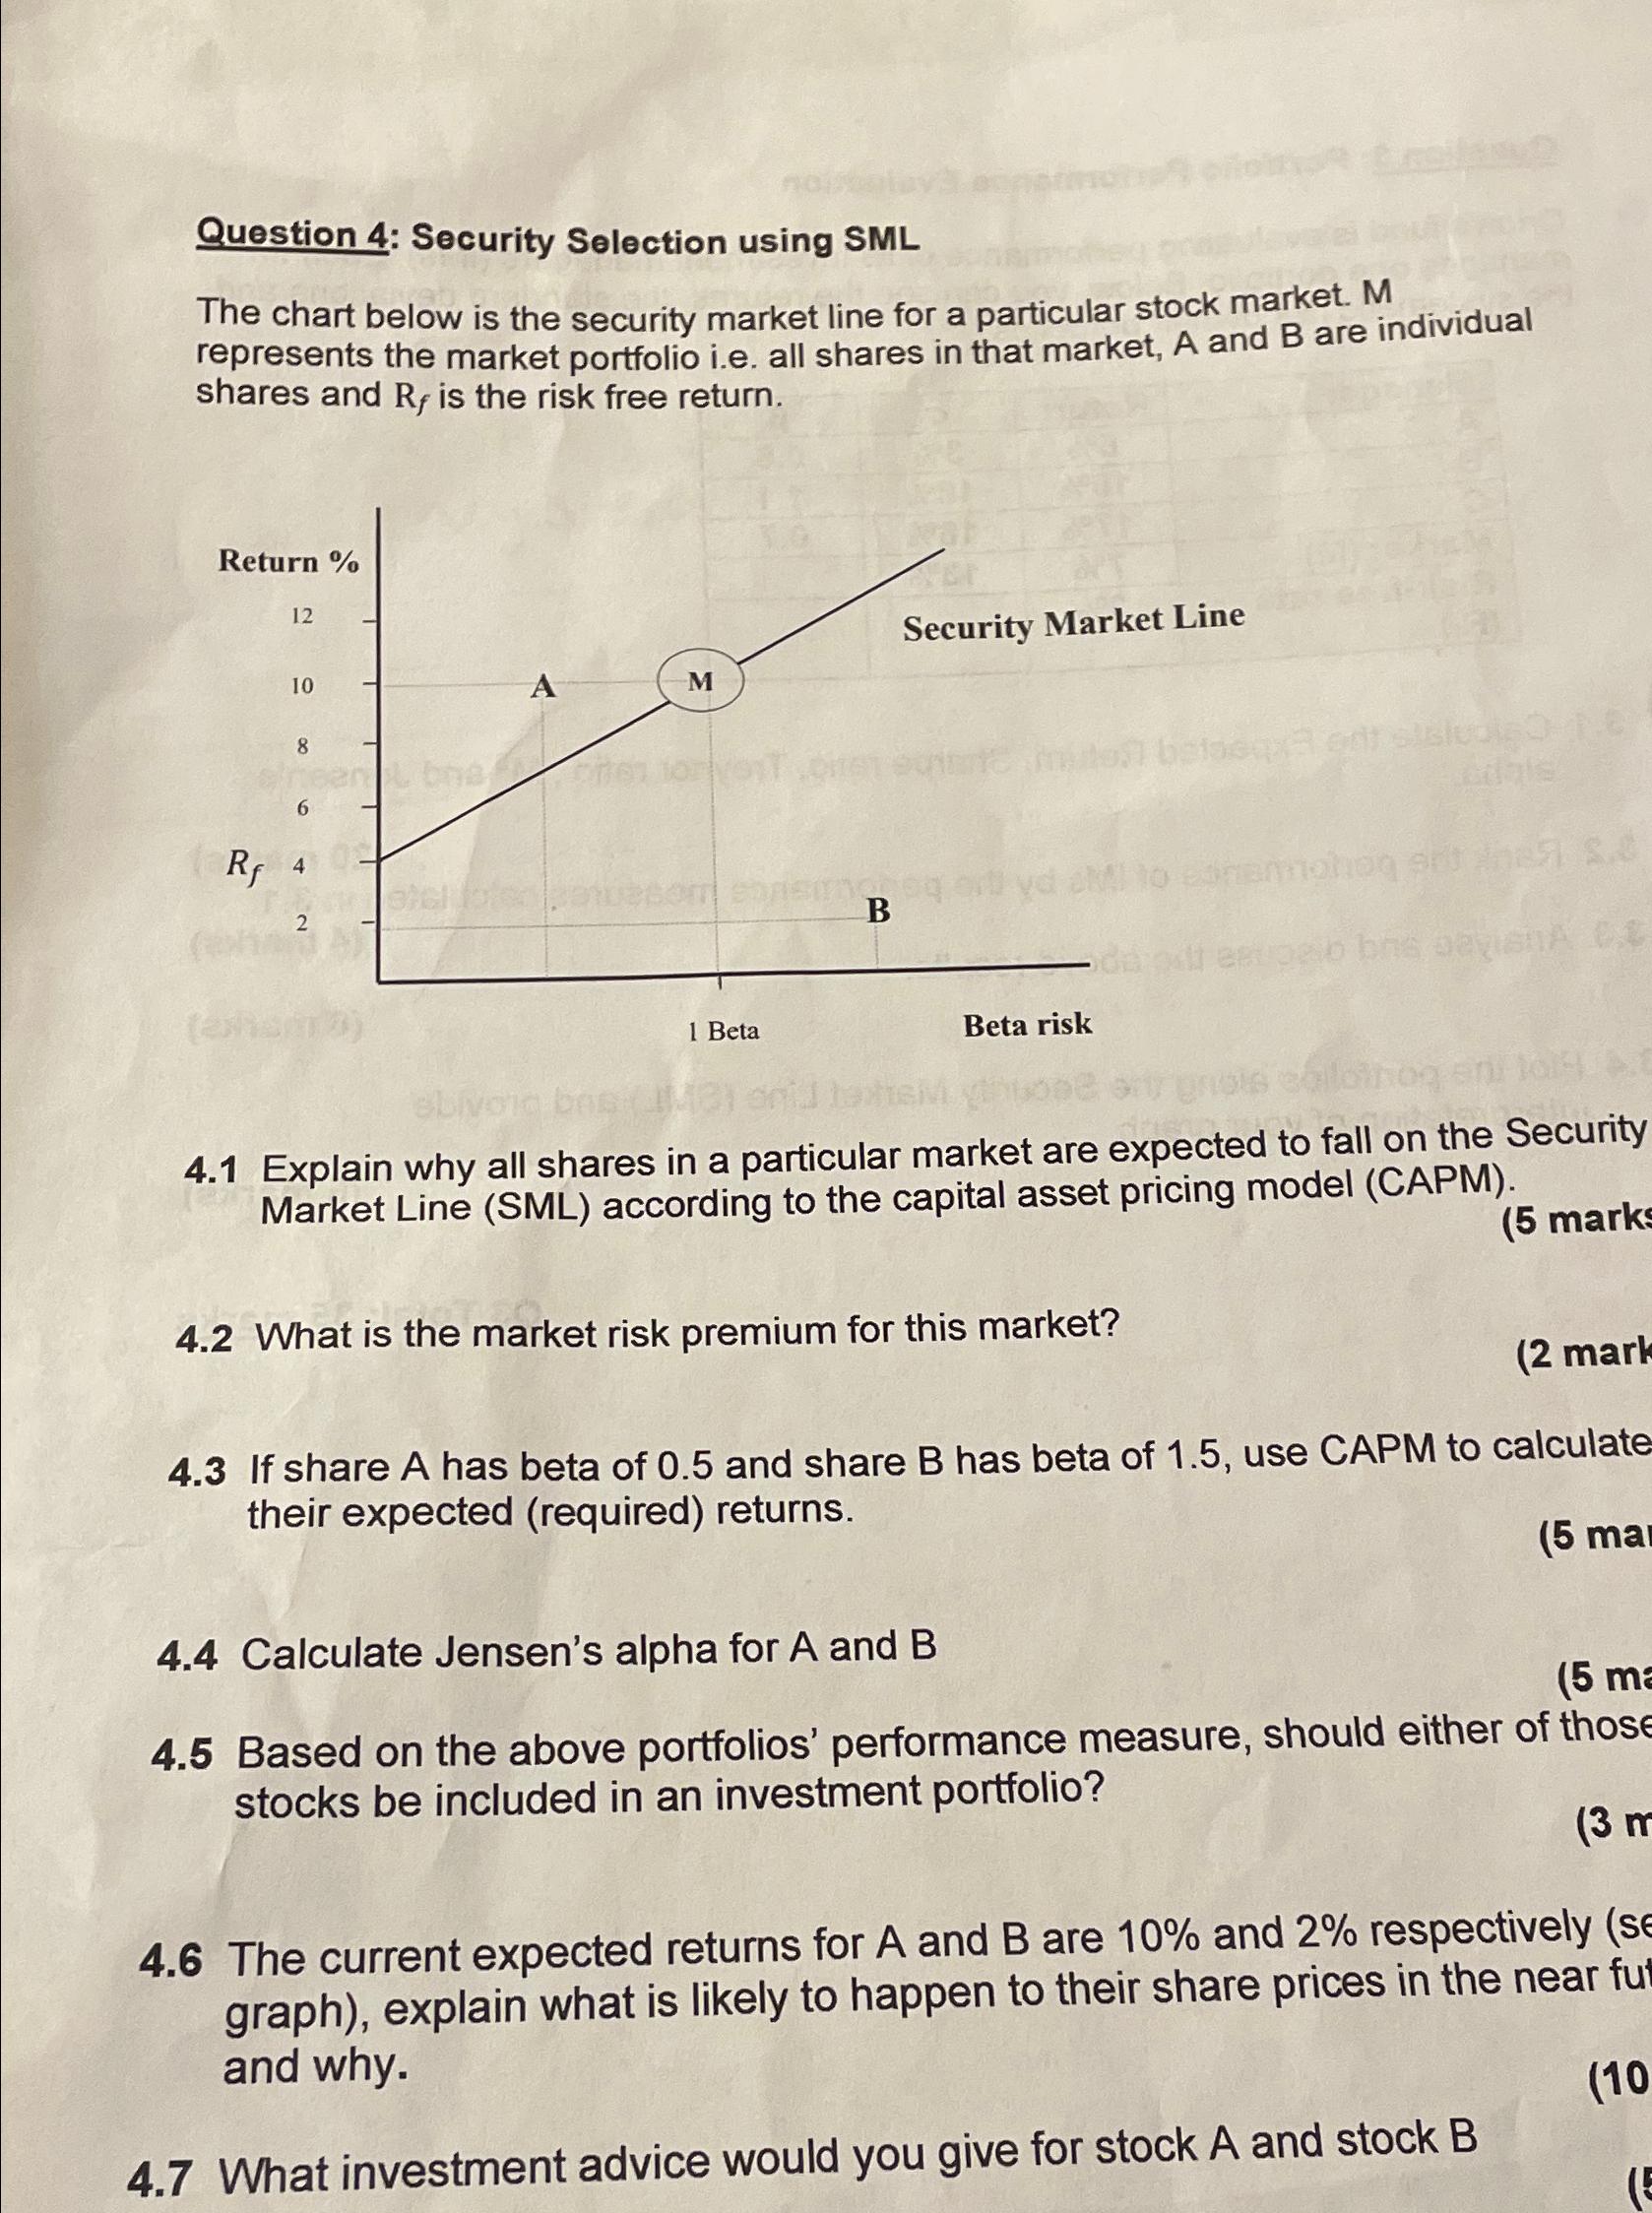
Question 4: Security Selection using SML The chart below is the security market line for a particular stock market. M represents the market portfolio

Question 4: Security Selection using SML The chart below is the security market line for a particular stock market. M represents the market portfolio i.e. all shares in that market, A and B are individual shares and R, is the risk free return. Return% Rf 12 10 8 6 40- 2 bna Bicl M om sonsing 1 Beta B Security Market Line v skl to Beta risk betaeqx3 ontsisluo0 1.6 4.2 What is the market risk premium for this market? cials emohon art 087 8.8 bne oavisnA CE ebivo grois soilothog en 1014 6.1 4.1 Explain why all shares in a particular market are expected to fall on the Security Market Line (SML) according to the capital asset pricing model (CAPM). de fo (5 marks (2 mark 4.3 If share A has beta of 0.5 and share B has beta of 1.5, use CAPM to calculate their expected (required) returns. (5 mar 4.4 Calculate Jensen's alpha for A and B (5 ma 4.5 Based on the above portfolios' performance measure, should either of those stocks be included in an investment portfolio? (3 m 4.6 The current expected returns for A and B are 10% and 2% respectively (se graph), explain what is likely to happen to their share prices in the near fut and why. (10 4.7 What investment advice would you give for stock A and stock B (5
Step by Step Solution
★★★★★
3.42 Rating (152 Votes )
There are 3 Steps involved in it
Step: 1
41 According to the Capital Asset Pricing Model CAPM all shares in a particular market are expected to fall on the Security Market Line SML because the expected return of a security is a function of i...
Get Instant Access to Expert-Tailored Solutions
See step-by-step solutions with expert insights and AI powered tools for academic success
Step: 2

Step: 3

Ace Your Homework with AI
Get the answers you need in no time with our AI-driven, step-by-step assistance
Get Started


