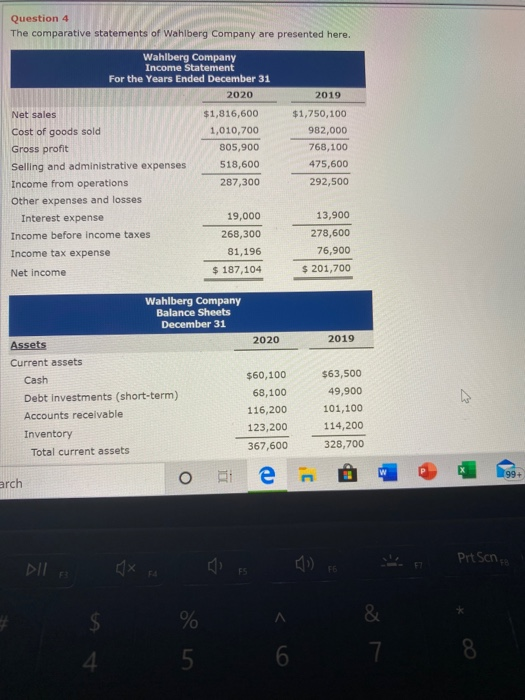
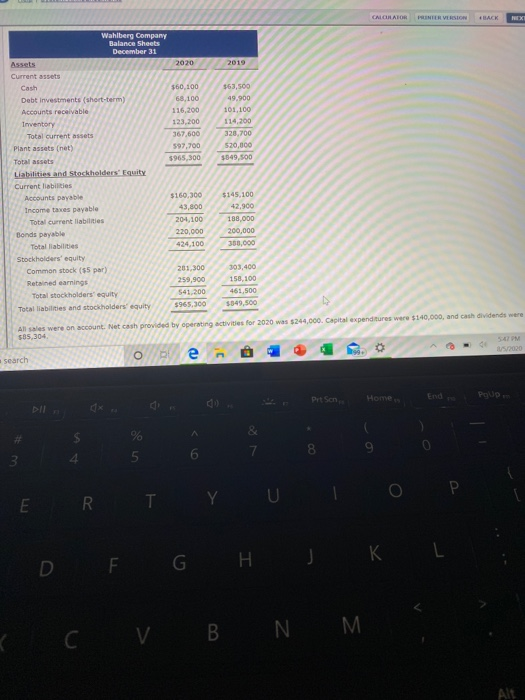
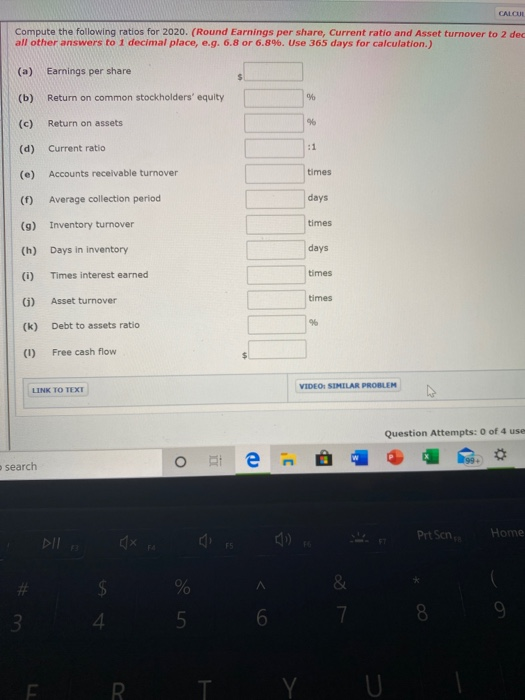
Question 4 The comparative statements of Wahlberg Company are presented here. Wahlberg Company Income Statement For the Years Ended December 31 2020 2019 $1,816,600 1,010,700 805,900 518,600 287,300 $1,750,100 982,000 768,100 475,600 292,500 Net sales Cost of goods sold Gross profit Selling and administrative expenses Income from operations Other expenses and losses Interest expense Income before income taxes Income tax expense Net income 19,000 268,300 81,196 $ 187,104 13,900 278,600 76,900 $ 201,700 Wahlberg Company Balance Sheets December 31 2020 2019 Assets Current assets Cash Debt Investments (short-term) Accounts receivable Inventory Total current assets $60,100 68,100 116,200 123,200 367,600 $63,500 49,900 101,100 114,200 328,700 99+ O arch Pit Scho DIL & % 5 6 8 CALCURATOR PRINTER VERSION BACK NEXT Wahlberg Company Balance Sheets December 31 2020 2019 $60,100 68,100 116,200 123,200 367,600 597,700 $965,300 $63,500 49.900 101,100 114,200 328,700 $20,000 $549,500 Current assets Cash Debt investments (short-term) Accounts receivable Inventory Total current assets Plant assets (net) Total assets Liabilities and Stockholders' Equity Current liabilities Accounts payable Income taxes payable Total current liabilities Bonds payable Total liabilities Stockholders' equity Common stock (55 par) Retained earnings Total stockholders' equity Total liabilities and stockholders' equity $145.100 42,900 $160,300 43,800 204,100 220,000 424,100 188,000 200,000 350,000 201,300 259,900 541,200 $965.300 303,400 158,100 461,500 5349,500 All sales were on account. Net cash provided by operating activities for 2020 was $244,000. Capital expenditures were $140,000, and cash dividends were SS 304 54 2020 e 0 n Search Home End Presen Poup U E RT Y G H DF K L c v B N M All CALCUL Compute the following ratios for 2020. (Round Earnings per share, Current ratio and Asset turnover to 2 dec all other answers to 1 decimal place, e.g. 6.8 or 6.896. Use 365 days for calculation.) (a) Earnings per share $ (b) Return on common stockholders' equity % Return on assets 96 (d) Current ratio :1 Accounts receivable turnover times Average collection period days (9) Inventory turnover times (h) Days in inventory days (1) Times interest earned times 6) Asset turnover times (k) Debt to assets ratio 96 (0) Free cash flow LINK TO TEXT VIDEO SIMILAR PROBLEM Question Attempts: 0 of 4 use search o B Home PrtScn , DILE % 5 6 7 9. R. . Y


